Usenet Retention Tests July 2026: How Much of Your Old Download Is Still There?

Usenet providers like to quote retention in days: 2,000 days, 5,000 days, 6,500 days. Those numbers are useful marketing shorthand, but they do not answer the question a subscriber is asking. Independent, published comparisons of real-world Usenet retention are scarce, so subscribers often have to rely on provider marketing claims or on individual reports that are useful but hard to compare systematically.
If I am considering a Usenet subscription, I want to know:
What is the probability that a real user-downloaded article posted in year Y is still available on provider P when I need it?
That is the question behind the retention-over-years chart in this article. The other charts answer related questions from different angles. Keeping those questions separate matters: a yearly cohort average, an age bucket, and a cumulative post-date curve are not interchangeable measurements.
The short version
If you only read one section, read this: the test measured whether real, user-downloaded binary segments are still retrievable from ten major Usenet providers, and the answer depends strongly on how old the post is. For recent posts, most providers look similar and availability is high. For older material, the providers split into a few clear groups:
- Eweka and Newshosting stay close to the top across the full measured age range.
- TweakNews and PureUsenet retain material well for several thousand days, then drop sharply in the oldest age buckets.
- Blocknews and EasyUsenet lose availability noticeably earlier than the top group.
- Giganews, ViperNews, and Usenet.Farm fall off a cliff around 90 days in this run and stay low, recovering only partly at older ages.
- UsenetExpress hits the same cliff but recovers substantially afterward — about 80% at older ages — so where it stands depends heavily on which age you look at.
None of these curves declines smoothly (see the note under Age-based retention).
The tested providers advertise retention ages from roughly 1,800 to 6,600 days. At the ages they advertise, measured binary availability in this sample ranged from about 99.9% down to roughly 43%. The advertised number describes the oldest age a provider intends to reach, not what is still available at that age; the direct comparison is in For users choosing a subscription below.
These results are binary segment-retention probabilities, not NZB completion rates: high segment availability does not guarantee that a download completes. For the quick answer, read this section and the first two charts. The infrastructure deep dive, technical methodology, and reference tables later in the article are optional detail.
Which chart should you look at?
- Want the answer for a particular post year? Start with Retention over years.
- Want to know how availability changes as posts age? Start with Age-based retention.
- Want to inspect cumulative reachability or historical patterns? Use the other numbered views in the Results section.
- Want to know whether a second provider is worth it? See the measured pairing comparison under For users choosing a subscription.
Test at a glance
- Dataset: approximately 78,000 real NZB files covering August 2008 through the end of July 2026.
- Sample: diverse real-world binary downloads, distributed at roughly 12 NZBs per calendar day.
- Sampling: up to 100 segment references per NZB.
- Providers: ten large, well-known providers selected to represent the major backbones.
- Measurement: whether each selected binary article body could still be retrieved.
- Test run: 22 days in July 2026, with approximately 33 TiB transferred.
- Provider failures: almost no segment checks had to be excluded because of provider failure.
- Scale: about 73.1 million stored rows, from up to 100 sampled segments per NZB on each of ten providers.
How availability was measured
This test measures binary segment retention, not NZB completion. An NZB is a map of the Usenet articles needed to reconstruct a download; each segment points to one such article. For every selected segment, the test used the NNTP ARTICLE command to request the actual article body, rather than relying only on STAT or HEAD, which can report metadata even when the body is gone. Successful article retrieval counted as available; expected “not found” or “removed” responses (430/451) counted as unavailable. The results therefore mean “percentage of included sampled segment checks whose bodies were retrievable,” not “percentage of NZBs that completed.”
What was tested
The dataset contains approximately 78,000 real NZB files covering posts from August 2008 through the end of July 2026. The NZBs were randomly selected from a diverse real-world collection of binary downloads spanning multiple content types, rather than being restricted to one narrow category. The sample was spread approximately evenly across the tested period: roughly 12 NZB files for each calendar day. This makes the dataset time-balanced instead of weighting the results according to the much larger upload volume of recent years. It is still a sample, not a census; it does not claim that every newsgroup, poster, file size, or content category is represented equally.
I selected up to 100 segments per NZB and checked them against ten providers. At the full 100-segment sample, that is:
78,000 NZBs × 100 sampled segments × 10 providers
= approximately 78 million provider/segment checks
Not every NZB has 100 segments, so the run stored about 73.1 million rows — 7,309,251 sampled segments checked against each of the ten providers.
The test ran over 22 days in July 2026 and consumed approximately 33 TiB of data because the ARTICLE probe retrieves each selected article body before classifying and discarding it (exact command and error handling: Technical methodology, step 3).
Provider selection was deliberate: the aim was to represent the major backbones rather than the many retail brands that may reach the same infrastructure. The provider table later explains those relationships, including why Newshosting and PureUsenet both appear under the Omicron label itself.
Results
The first two charts are the primary views for comparing providers. The remaining charts provide additional historical and diagnostic perspectives. Each graph states the question it answers; only the age-based chart uses the 95% qualification rule.
1. Retention over years: the user-facing yearly probability
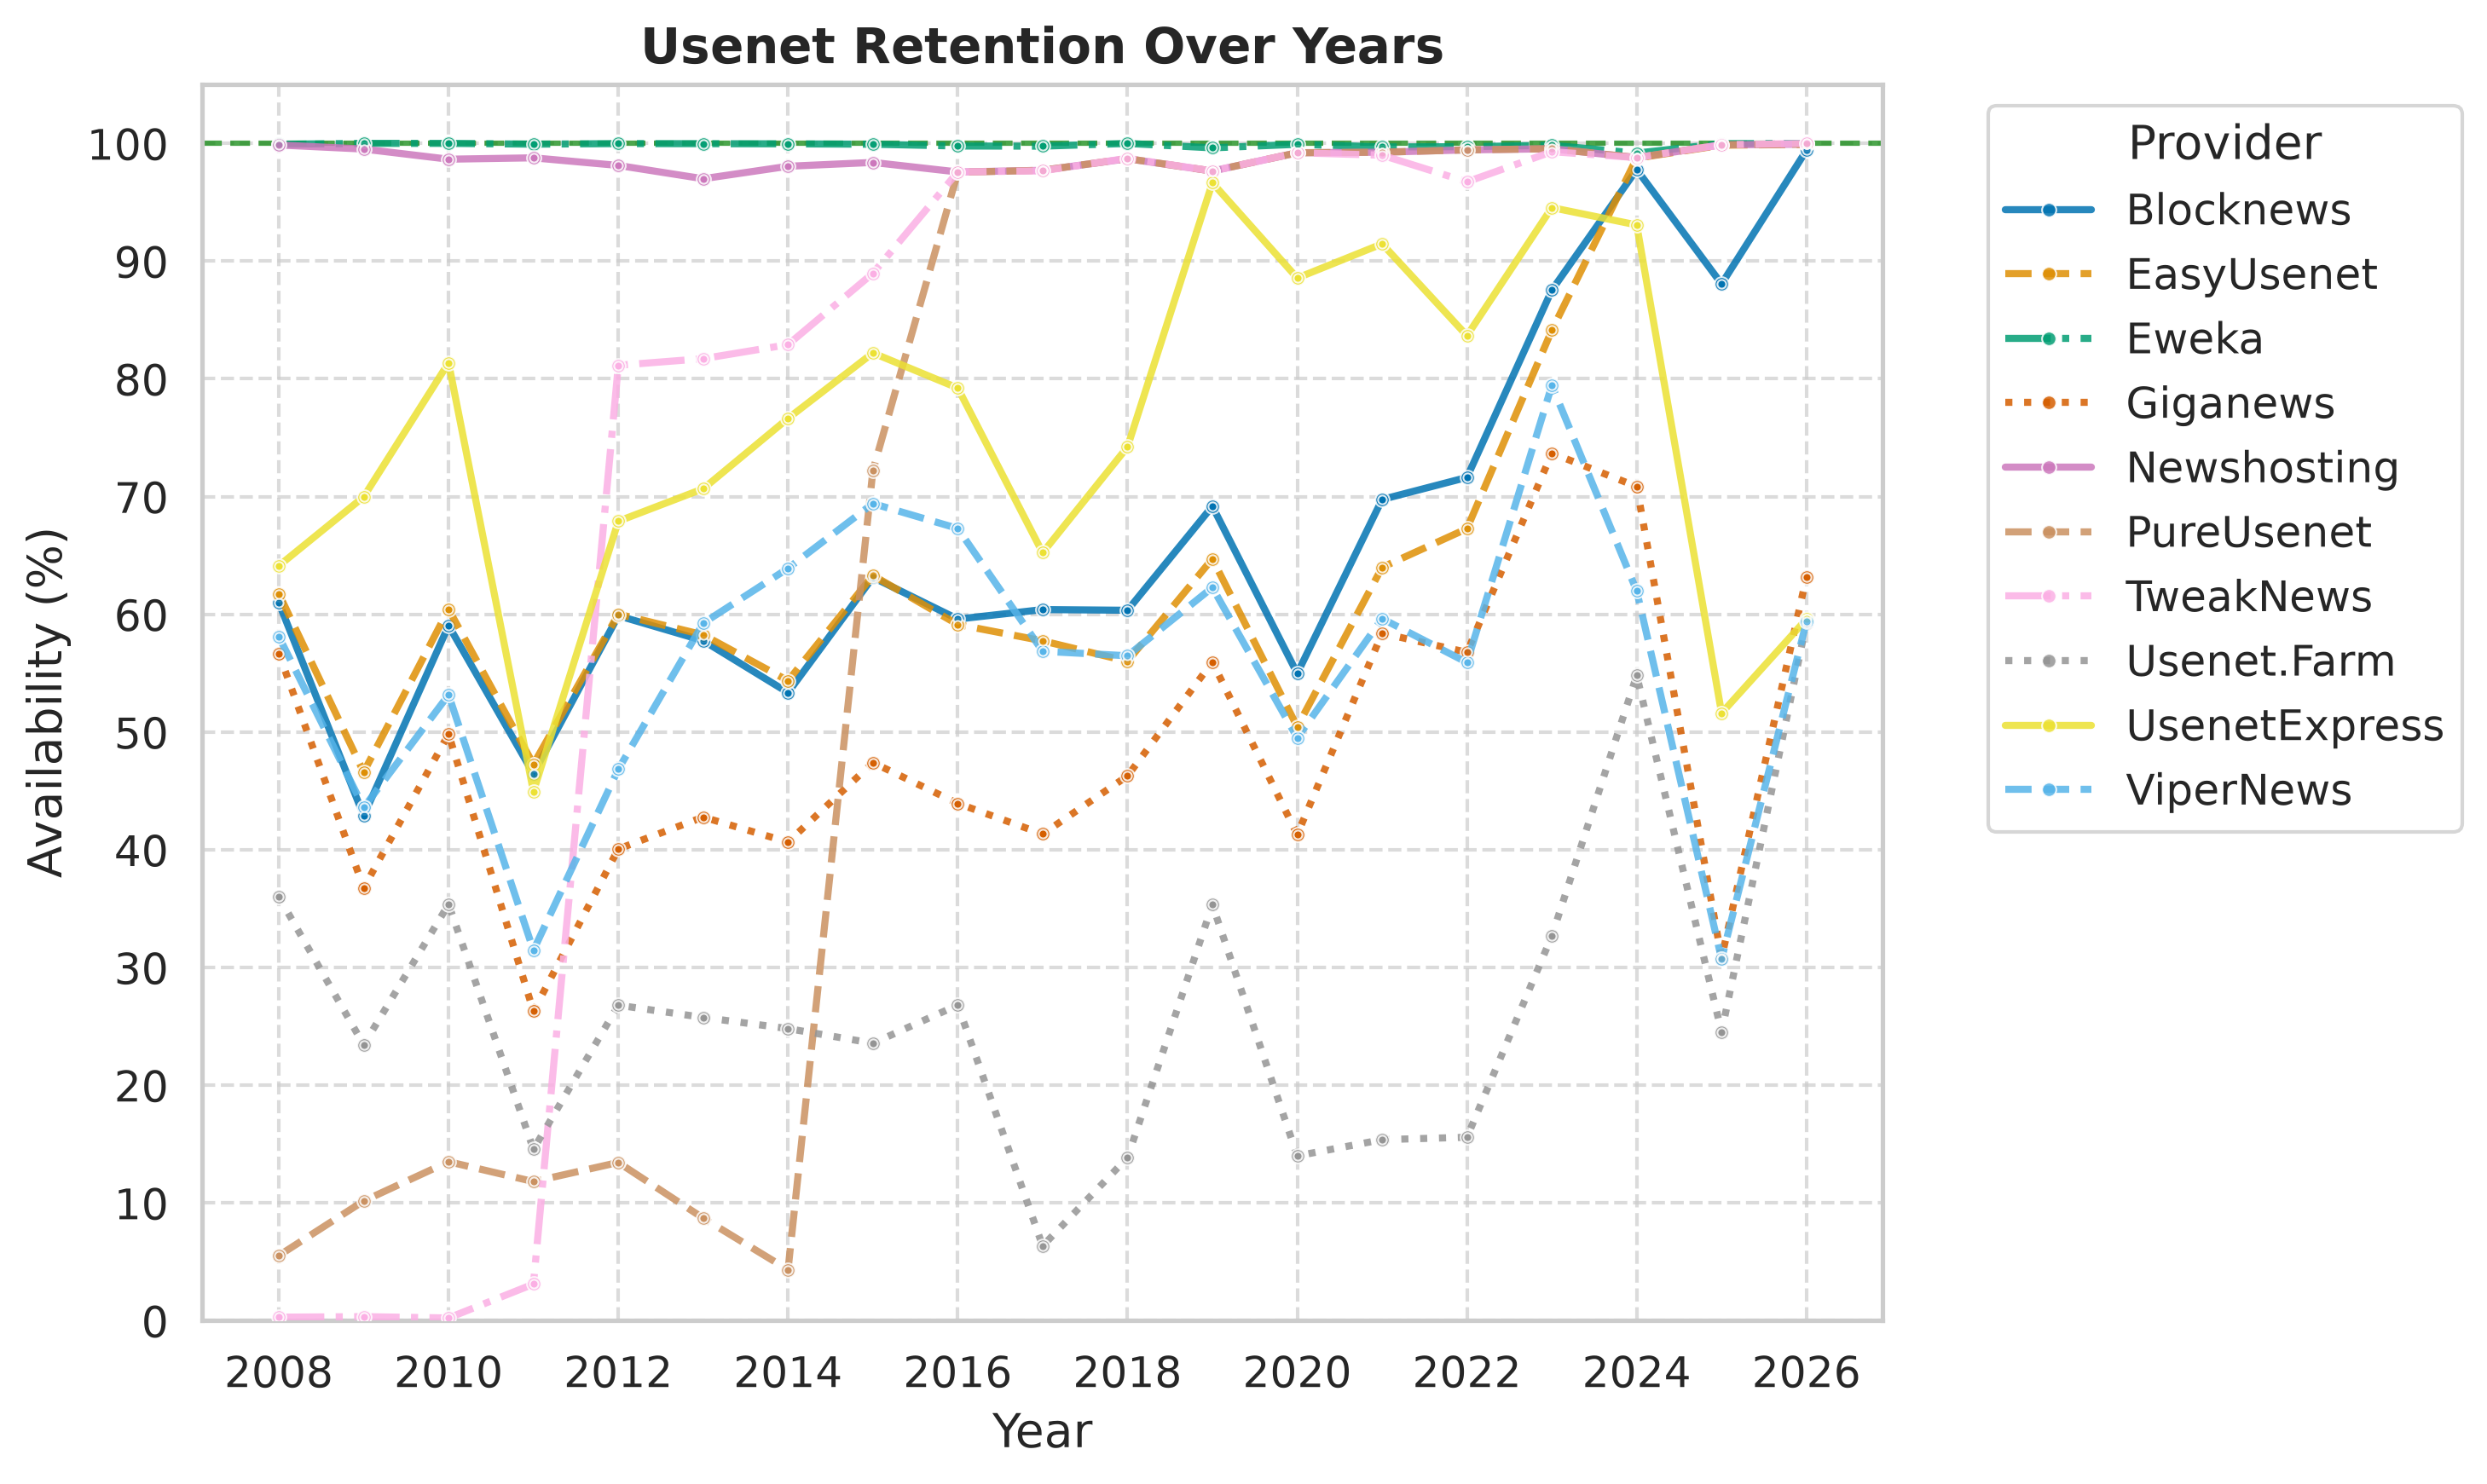
Bottom line: Eweka and Newshosting stay essentially flat at the top in every cohort; everyone else falls away at some point. The providers diverge increasingly as the chart moves back through older cohorts: TweakNews and PureUsenet are strong for later publication-year cohorts but lose much more availability in earlier cohorts; Blocknews, EasyUsenet, and UsenetExpress occupy a more variable position; and Giganews, ViperNews, and Usenet.Farm sit far below the top group at every checkpoint, without declining steadily as the cohorts get older.
To avoid choosing years because they make a convenient point, the numeric checkpoints below use a fixed five-year spacing: 2010, 2015, 2020, and 2025, with 2026 shown separately as the incomplete endpoint of the dataset.
| Provider | 2010 | 2015 | 2020 | 2025 | 2026* |
|---|---|---|---|---|---|
| Eweka | 100.00% | 99.93% | 99.92% | 99.97% | 100.00% |
| Newshosting | 98.65% | 98.38% | 99.20% | 99.87% | 99.93% |
| PureUsenet | 13.50% | 72.22% | 99.20% | 99.88% | 99.93% |
| TweakNews | 0.23% | 88.97% | 99.20% | 99.88% | 100.00% |
| EasyUsenet | 60.43% | 63.30% | 50.44% | 99.85% | 99.91% |
| Blocknews | 59.04% | 63.13% | 54.97% | 88.06% | 99.41% |
| UsenetExpress | 81.36% | 82.20% | 88.56% | 51.60% | 59.59% |
| ViperNews | 53.16% | 69.40% | 49.51% | 30.72% | 59.36% |
| Giganews | 49.83% | 47.40% | 41.29% | 30.81% | 63.17% |
| Usenet.Farm | 35.37% | 23.56% | 14.00% | 24.51% | 59.27% |
* 2026 is a partial publication year covering January through July, and recent posts have had far less time in which to disappear than older cohorts. 2008 is also partial because the sample begins in August, so it is not used as a regular checkpoint.
These are publication-year averages from this sample, not completion rates. The fixed checkpoints make the broad movement easy to compare.
How to read it: Pick a publication year on the x-axis and compare the provider lines at that year. The value is the availability of sampled segments from posts published in that year—not a measurement of what happened during that calendar year and not a cohort followed repeatedly as it aged.
It answers:
For real, user-downloaded binary material posted in calendar year Y, what percentage of its sampled segments were still available on provider P when checked?
For every provider and publication year, the analysis groups results by the year of nzb_date and averages the stored availability value.
The line connecting the yearly points is there to make the historical shape easy to see. It does not mean that the provider’s retention changed smoothly between two years, and it does not interpolate missing data.
The fixed checkpoints show the main shape without relying on a hand-picked year:
- PureUsenet and TweakNews rise from very low availability in 2010 to roughly 99% by 2020 and 2025.
- Blocknews and EasyUsenet vary by cohort rather than following one smooth decline; EasyUsenet is near 100% in 2025 after much lower values in 2010–2020, while Blocknews remains weaker in 2025.
- UsenetExpress is comparatively strong through 2020 but falls to 51.60% for the 2025 cohort.
- Giganews, ViperNews, and Usenet.Farm are the weakest group at every checkpoint, but their weakness does not simply grow with age: Giganews and ViperNews score higher in 2010 than in 2025, and Usenet.Farm's low point is 2020. The age-based section below returns to this non-monotonic shape.
This chart is particularly useful when you have a specific publication year in mind: read that year directly. Use the age-based chart instead if the question is “How does availability change after 1,000 or 3,000 days?”
2. Age-based retention: the 90-day bucket and the 95% rule
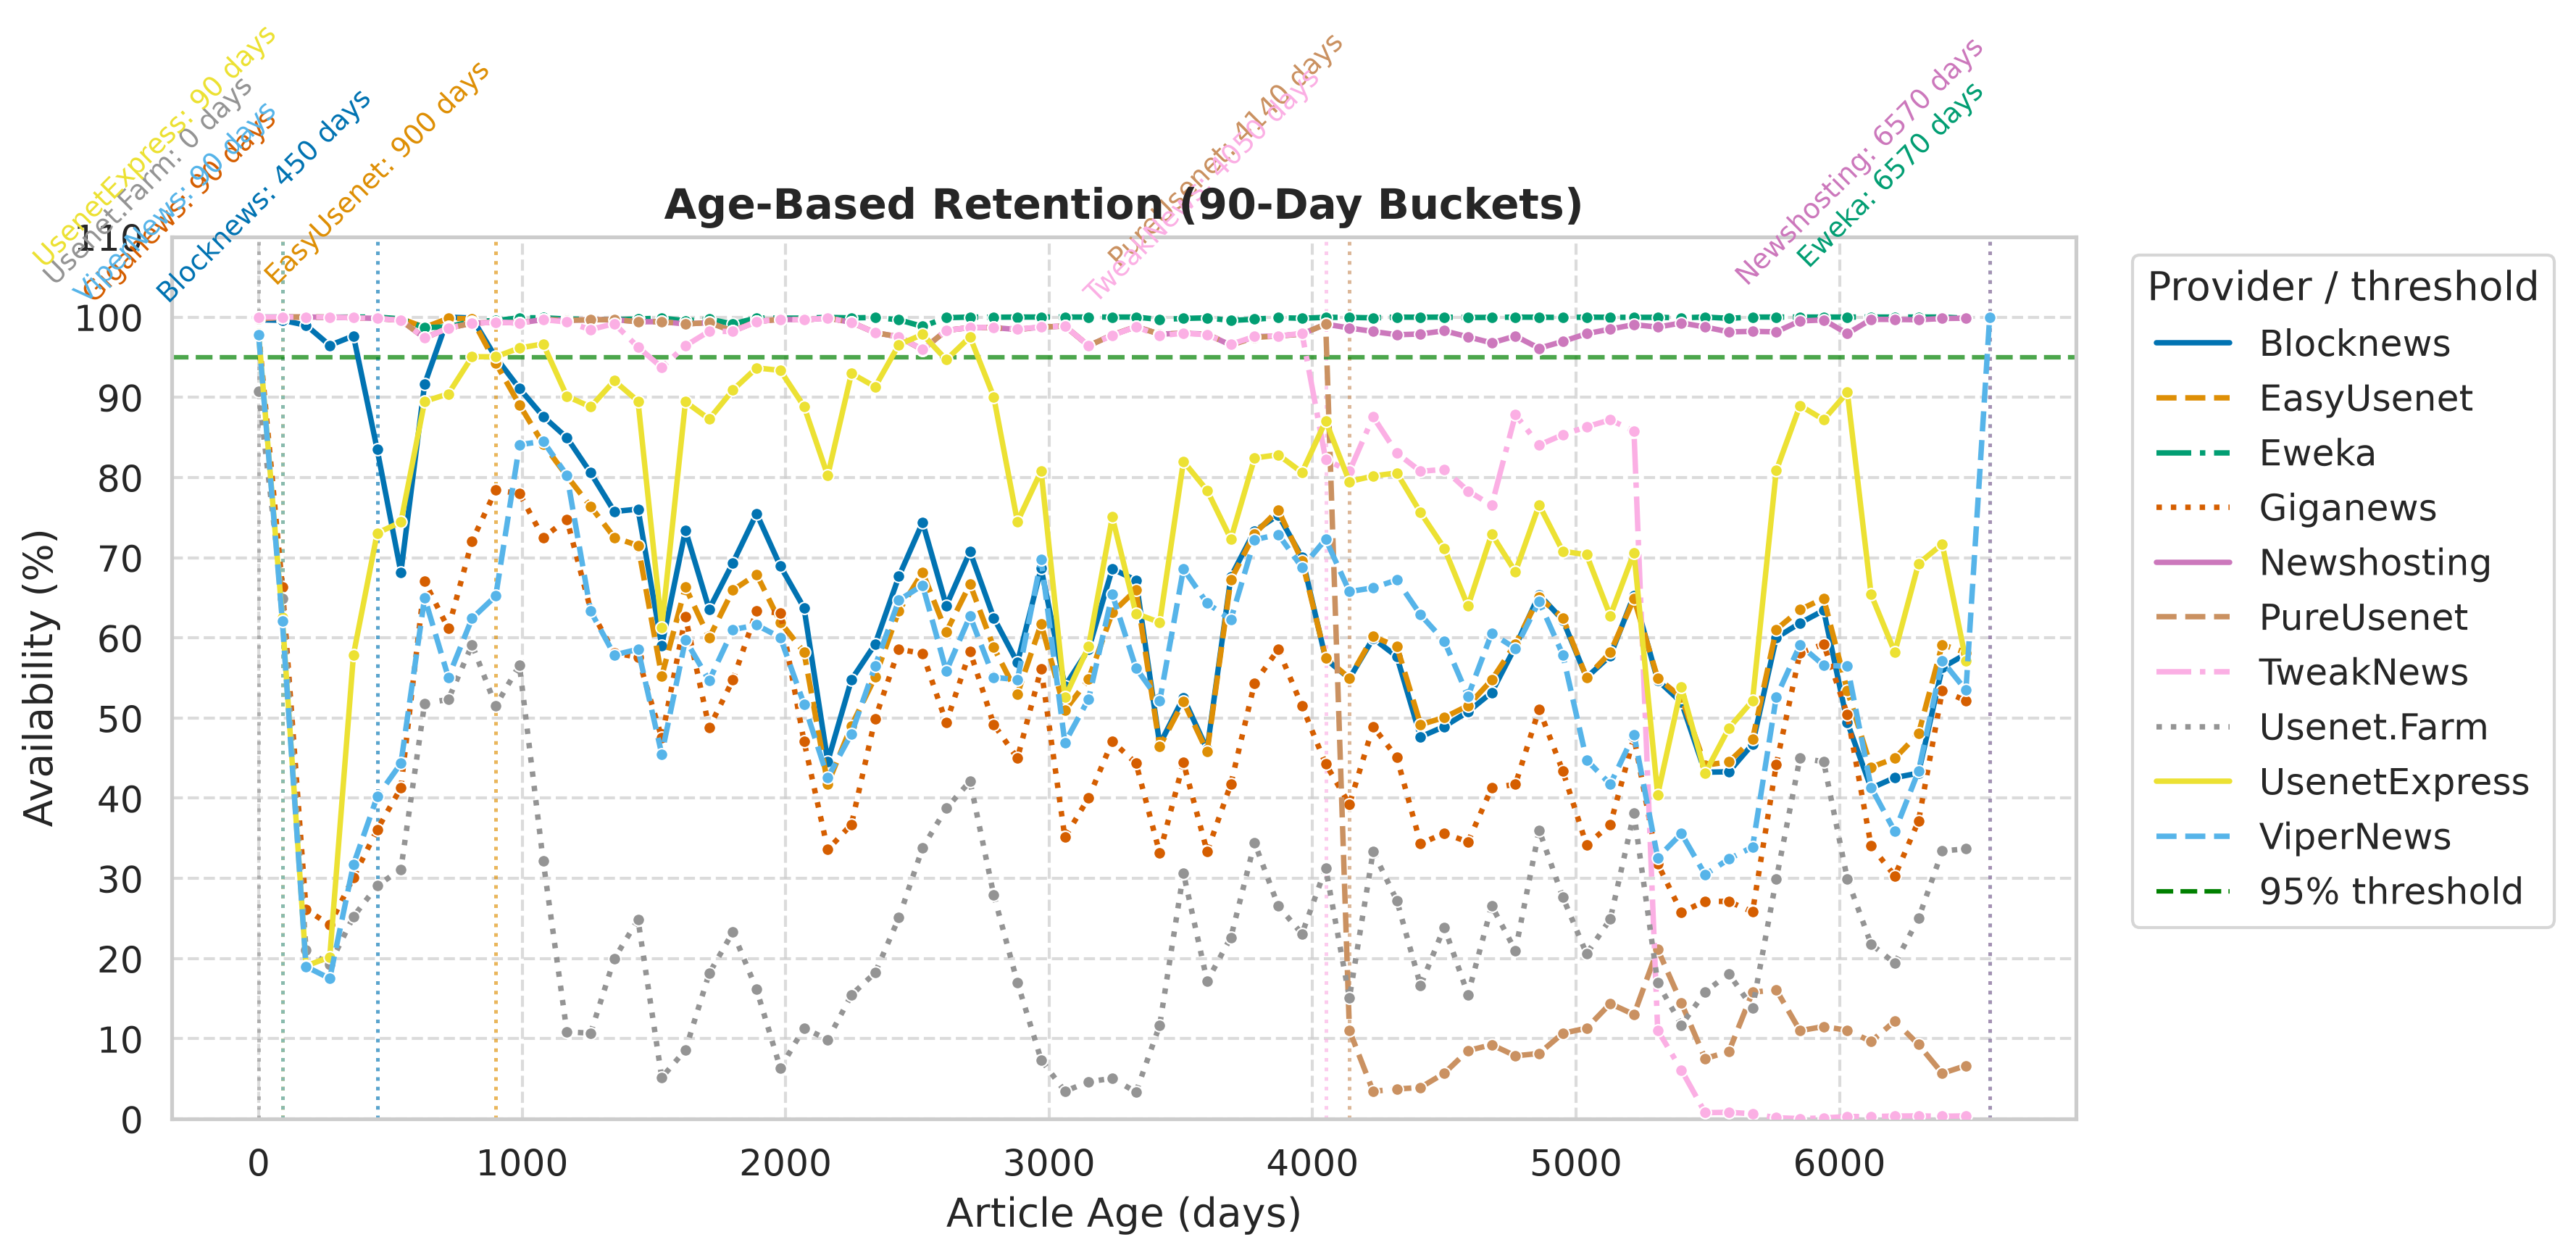
Bottom line: Nobody decays smoothly here — each provider has a cutoff, and the cutoffs cluster at a few distinct ages. Under the 95% rule used here, Eweka and Newshosting qualify through 6,570 days, TweakNews through 4,050 days, PureUsenet through 4,140 days, Blocknews through 450 days, and EasyUsenet through 990 days. Giganews, UsenetExpress, and ViperNews qualify through 90 days, while Usenet.Farm is already below the threshold in the first measurable bucket and has a reported horizon of 0 days. These are horizons produced by this test’s rule and sample, not provider-advertised retention limits.
How to read it: Follow one provider’s line from left to right as article age increases. The dotted provider marker is not the age at which every download fails; it is the end of the last accepted bucket under this test’s 95% availability rule and its one-bucket grace period.
This is the main chart for the practical retention horizon.
It answers:
For posts that were this old when checked, what percentage of their sampled segments were still available on each provider?
Age is calculated as:
age = checked_at − nzb_date
The results are grouped into 90-day ranges:
0–90 days
90–180 days
180–270 days
and so on
For each provider and bucket, the plotted value is:
available segments ÷ included segment checks × 100
The values are raw bucket percentages. They are not cumulative, they are not a rolling average, and they do not follow the same NZB repeatedly over time. The chart compares all sampled segments belonging to posts of similar age.
The green 95% line is the qualification threshold. The cutoff logic is:
- A bucket at or above 95% passes.
- One isolated bucket below 95% is allowed.
- If the next consecutive bucket also falls below 95%, the horizon ends.
The analysis requires at least 30 eligible segment checks for a provider/bucket before keeping that bucket. The reported horizon is the end of the last accepted bucket, not necessarily the first bucket that dips below 95%.
How precise is a single bucket? If a bucket holds only the required minimum of 30 eligible segment checks, one segment is worth roughly 3.3 percentage points of that bucket’s result (1 ÷ 30 × 100). At 300 checks, one segment is worth about 0.33 points. Segments sampled from the same NZB are correlated: the effective number of independent observations is lower than the raw check count, and the true uncertainty is larger than this suggests.
The 95% threshold is a practical reporting convention for this analysis, not an industry standard or a point at which a provider suddenly becomes unusable. It means that roughly one in twenty included sampled segment checks was unavailable. There is also a practical Usenet reason why this boundary is intuitive: many NZBs include roughly 5–10% PAR2 parity data. A 5% segment loss is therefore in the range that some commonly repaired downloads may be able to tolerate, depending on how the missing segments are distributed and how much recovery data that particular NZB contains. This gives the threshold practical context, but does not make it objectively correct: parity is provided per NZB, while this test aggregates sampled segments across many NZBs. A stricter threshold, such as 99%, would end the reported horizon after much smaller losses; a looser threshold, such as 90%, would continue it despite more noticeable degradation.
The one-bucket grace rule is similarly deliberate but not fundamental: it prevents one noisy 90-day interval from defining the entire horizon. Requiring two consecutive failing buckets makes the marker less sensitive to sampling variation, an isolated operational incident, or an unusual group of sampled NZBs. Other thresholds, bucket sizes, minimum sample requirements, or statistical methods could reasonably produce different horizons. I chose these rules to provide a simple and comparable summary, but I am open to feedback on whether another definition would better represent practical Usenet retention.
Vertical dotted annotations show the resulting horizons calculated from the raw bucket values.
What the age-based chart shows
The exact reported horizons are:
| Provider | Horizon under this test’s 95% rule |
|---|---|
| Eweka | 6,570 days |
| Newshosting | 6,570 days |
| PureUsenet | 4,140 days |
| TweakNews | 4,050 days |
| EasyUsenet | 990 days |
| Blocknews | 450 days |
| Giganews | 90 days |
| UsenetExpress | 90 days |
| ViperNews | 90 days |
| Usenet.Farm | 0 days |
Eweka and Newshosting stay near 100% through the full measured age range. That range ends at roughly 6,570 days because the sample begins in August 2008, the oldest point at which this test can evaluate how long any provider in the comparison has retained this type of material. Usenet itself is much older—text posts predate that period by many years—and text retention is outside the scope of this test.
The curves are not a smooth decline. For the providers that fall off the ~90-day cliff, the oldest material is not the weakest. Giganews is about 21.50% at day 365 in the first-year detail but 54.7% in the bucket spanning its 1,825-day claim and 56.2% at 3,000 days; UsenetExpress is about 37.38% at day 365 but 80.6% in the bucket spanning its 4,000-day claim and 88.56% for the 2020 cohort; Blocknews has a 450-day horizon under this rule yet still measures 43.2% around the 5,500-day claim. For these providers the lowest measured values sit in the first couple of years after posting, and older cohorts partially recover. This test cannot establish why: selective survival (the old articles a provider still holds are not a random subset of what was posted), takedowns or pruning concentrated in particular eras, and differences in the sampled material would all produce this shape. The practical consequence is not to extrapolate the cliff downward—a fifteen-year-old post is not automatically in worse shape than a two-year-old one here—but to read the yearly and bucket values at the age you actually care about.
3. Cumulative retention horizon: adding older post dates from the right
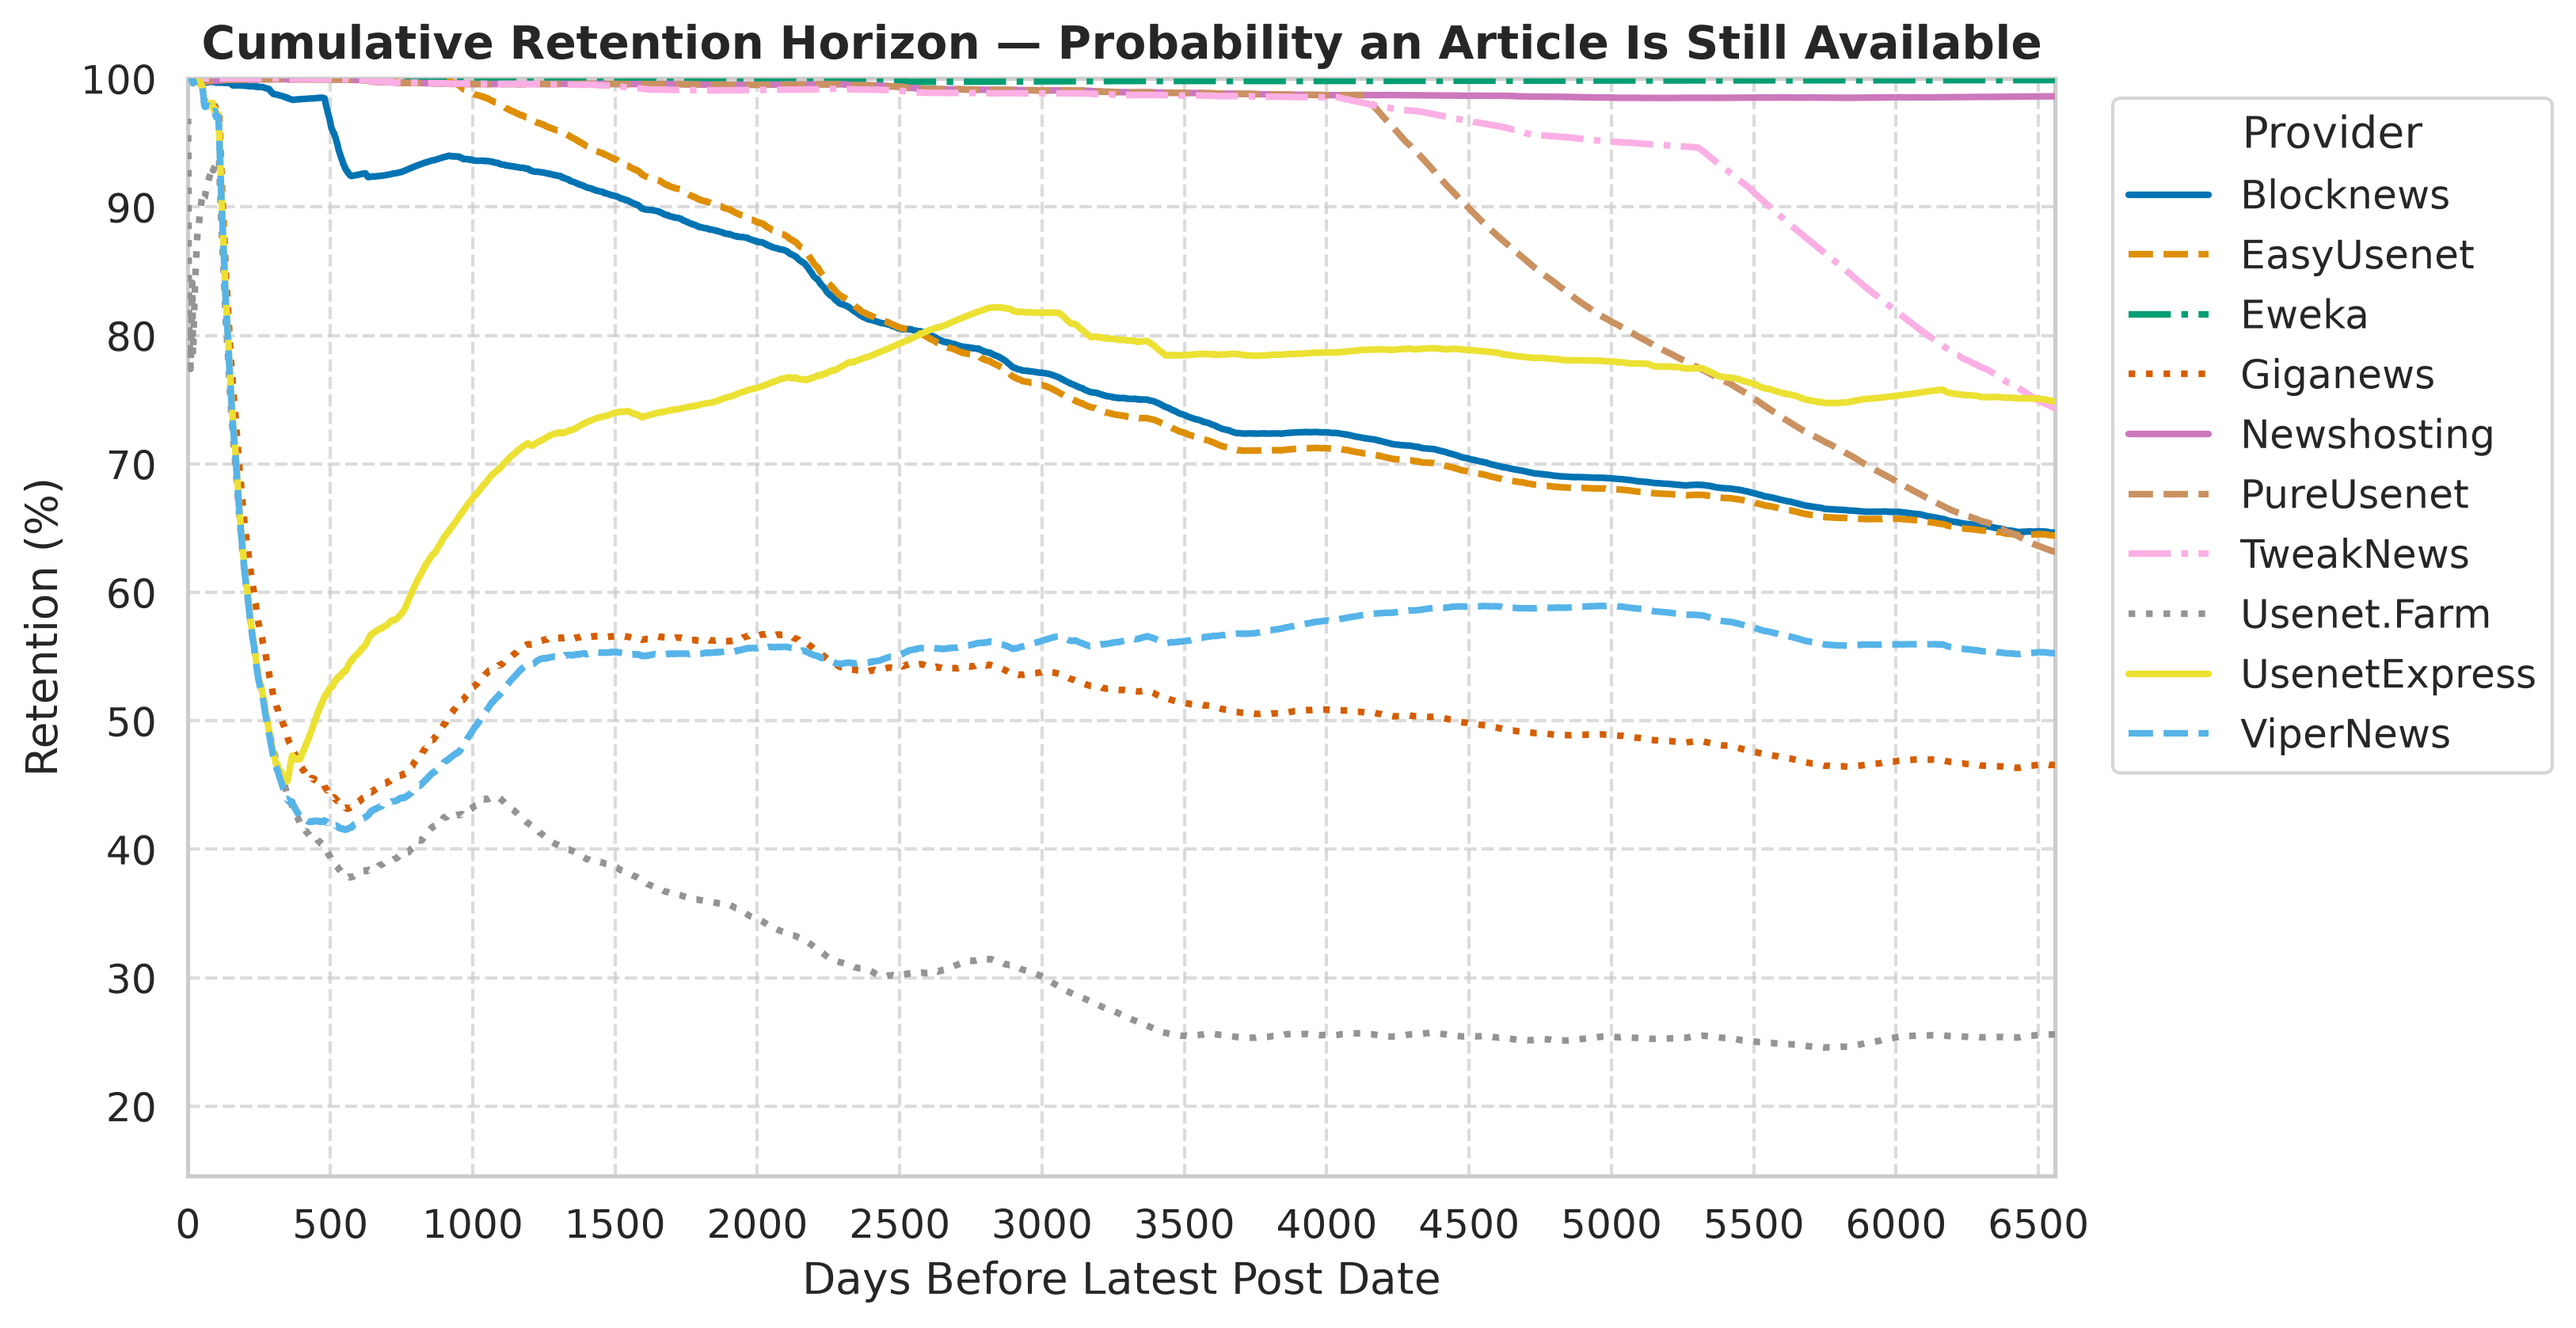
Bottom line: Over the complete date range back to 2008, Eweka still has essentially all of it and Usenet.Farm barely a quarter. At the oldest included date, Eweka is about 99.88% and Newshosting about 98.62%; TweakNews and PureUsenet are about 74.34% and 63.14%; Blocknews and EasyUsenet are about 64.64% and 64.42%; UsenetExpress is about 74.87%; and Giganews, ViperNews, and Usenet.Farm finish at about 46.58%, 55.27%, and 25.58%, respectively. These are cumulative values, so they include all younger material as well as the oldest material.
How to read it: The left side starts with the newest post date. Moving right keeps every younger cohort already included and adds older post-date cohorts. A downward step means the newly added older material performs worse than the cumulative range already included.
The x-axis is days before the latest post date.
The chart asks one question: if I include everything from the latest post date back to a given older date, what percentage of all sampled segments in that complete range is still available on provider P?
The newest post date is on the left. For each provider and each date, the analysis cumulatively adds the number of probed segments and the number that were available, then plots:
cumulative available segments ÷ cumulative included segment checks × 100
This is a cumulative post-date view, not a survival curve: it does not ask “what percentage of posts exactly 3,000 days old survive?” Each plotted value covers the complete younger range plus the older material added at that date.
What the chart shows:
- Eweka forms an almost flat line at the top, and Newshosting stays close to it across the range.
- TweakNews and PureUsenet hold a high cumulative level for much of the chart before dropping at the oldest end.
- UsenetExpress remains above the lowest group but loses a substantial share of older material.
- Giganews, ViperNews, and Usenet.Farm end much lower than the top providers for the oldest included posts.
The curves can move gradually rather than falling at one exact retention boundary because each plotted value is a cumulative ratio. A newly added older cohort can pull the ratio down, or occasionally pull it up if that cohort performs better than the material already included.
Practical interpretation: Use this view when you want to know how much of a sampled archive remains reachable after extending its date range backward—but not for identifying the availability of posts at one particular age.
4. Provider delta: how far below the best yearly result
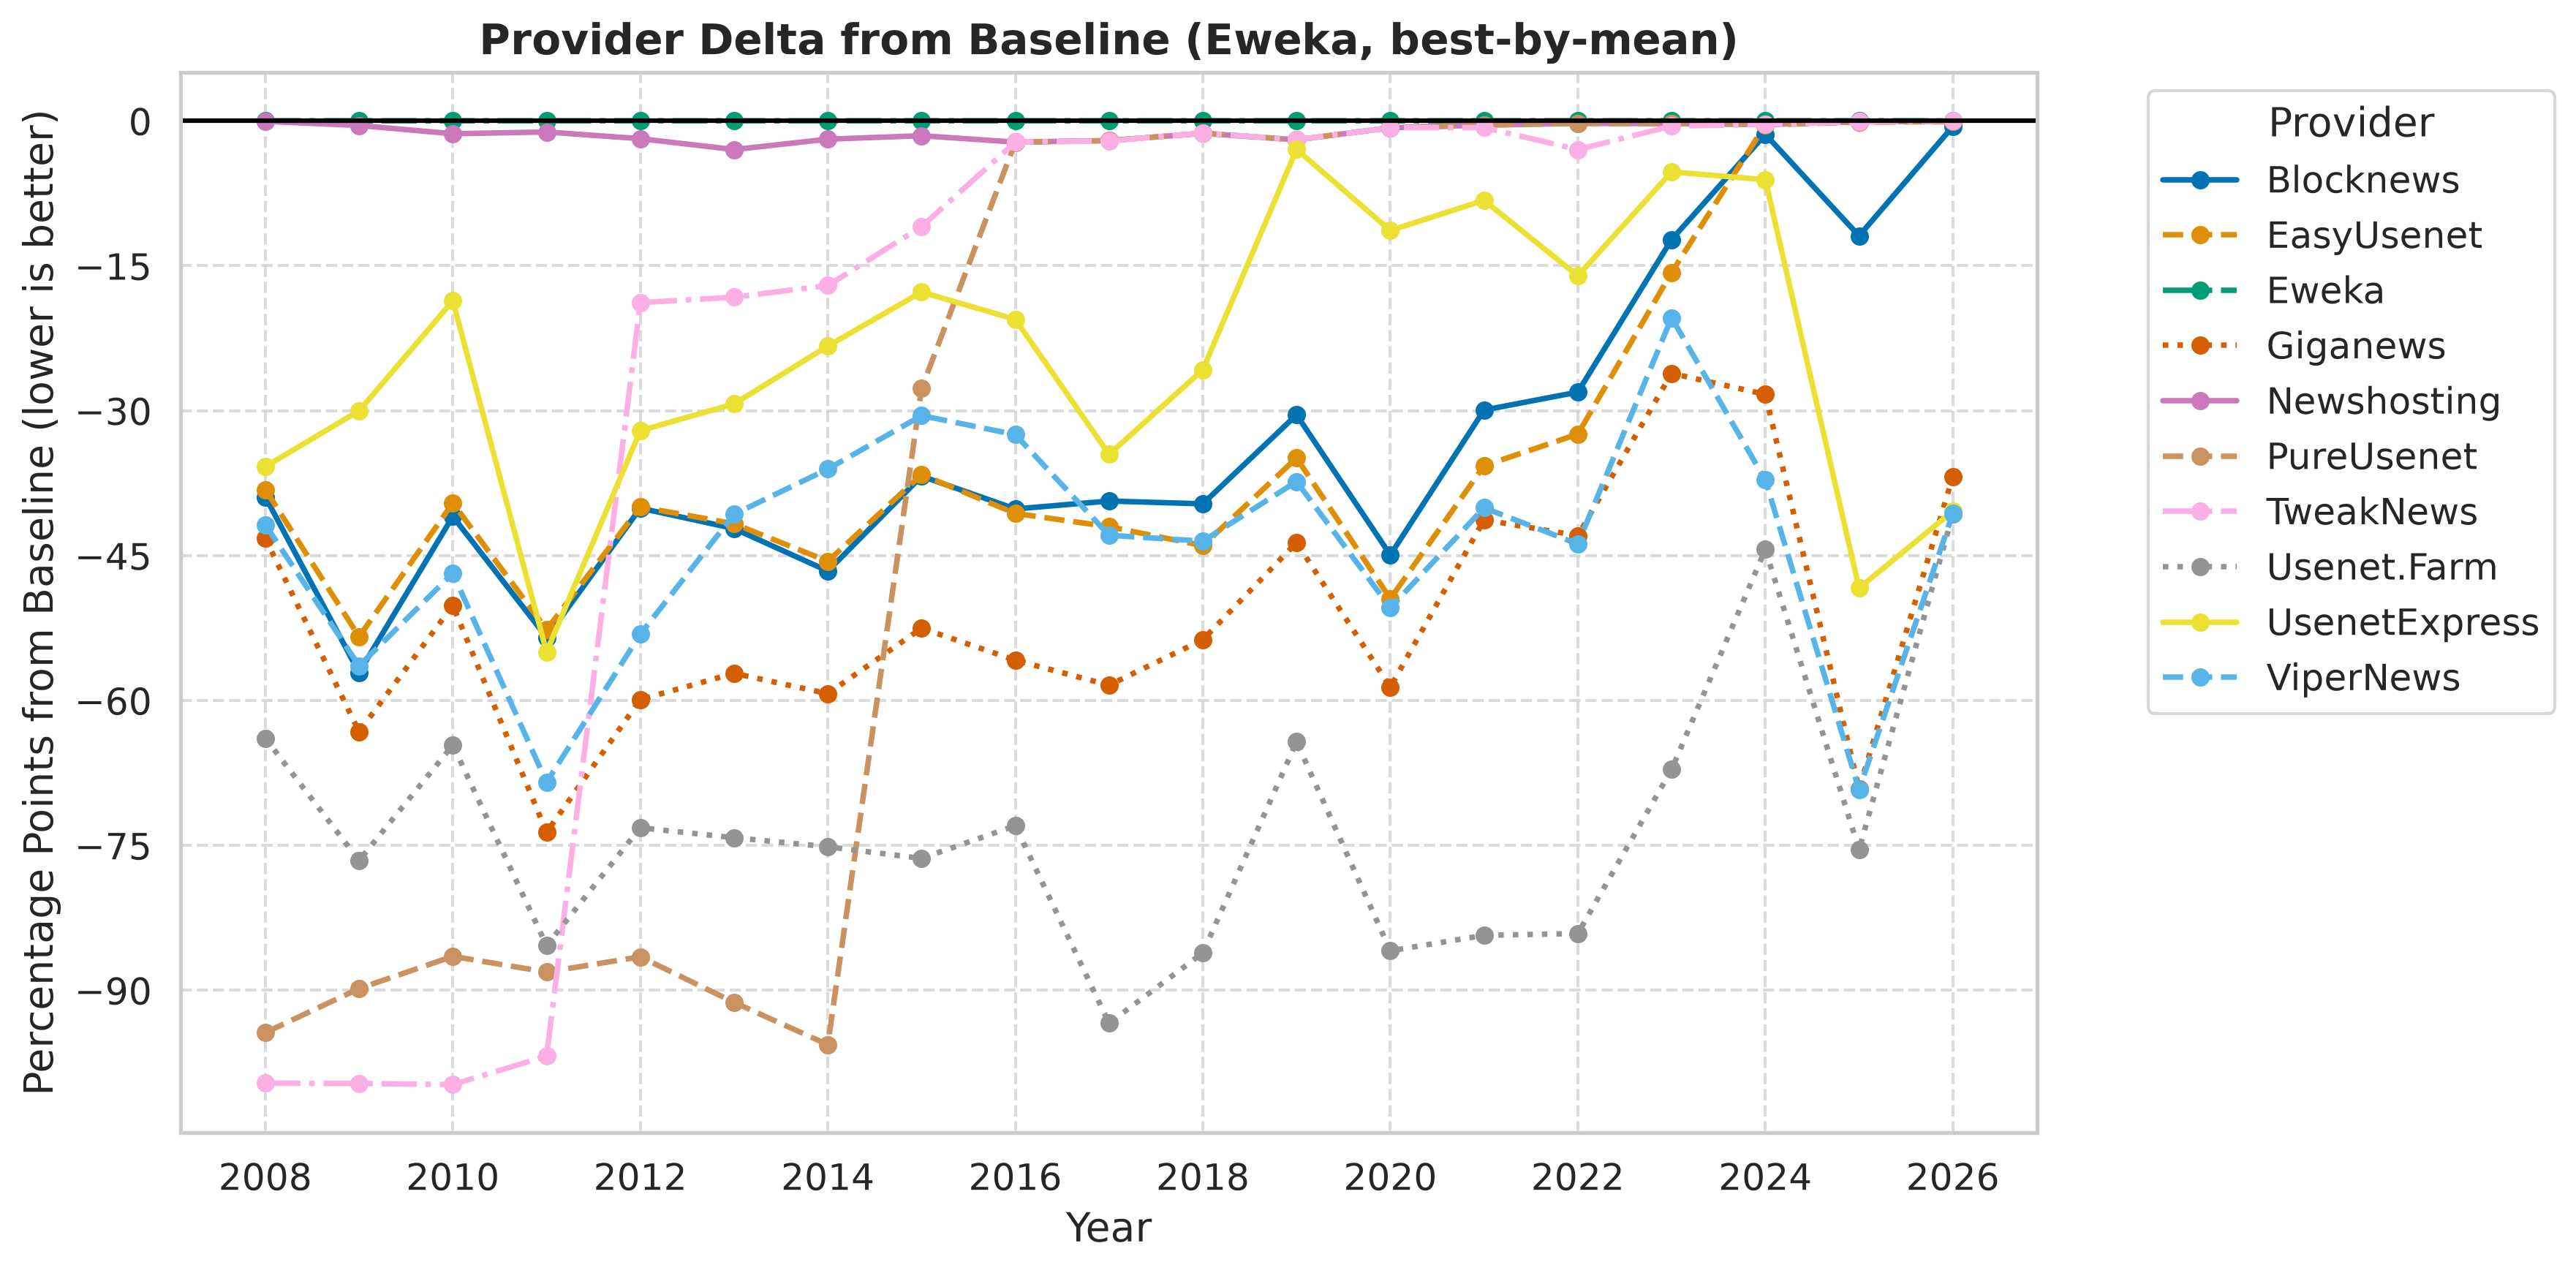
Bottom line: The gap between providers is tiny in recent years and enormous in old ones. The graph makes the historical gap easy to compare, but it deliberately removes the absolute availability level by using the best provider as a moving baseline.
How to read it: This chart plots percentage-point differences, not retention percentages. Zero means “best of the tested providers for this year,” not “100% available”; a negative value is that year’s gap from the best result, so −40 is a forty-point shortfall, not 40% retention. Always pair this graph with Retention over years before judging whether a difference is practically large.
Put as a question: for each publication year, how many percentage points below that year’s best-performing provider did provider P finish?
For each publication year, the analysis finds the provider with the highest yearly availability and calculates:
provider delta = provider availability − best provider availability
The best provider for a year is therefore at zero for that year. In this run, Eweka is the visible baseline throughout most of the historical range, although TweakNews is the best provider for the incomplete 2026 cohort. Using the same fixed checkpoints as the yearly chart, Newshosting is 1.34 percentage points below Eweka in 2010, 1.55 points below in 2015, 0.72 points below in 2020, and 0.10 points below in 2025. TweakNews moves from 99.77 points below Eweka in 2010 to 10.96 points below in 2015 and 0.10 points below in 2025.
5. First-year retention detail: daily averages with a 30-day rolling view
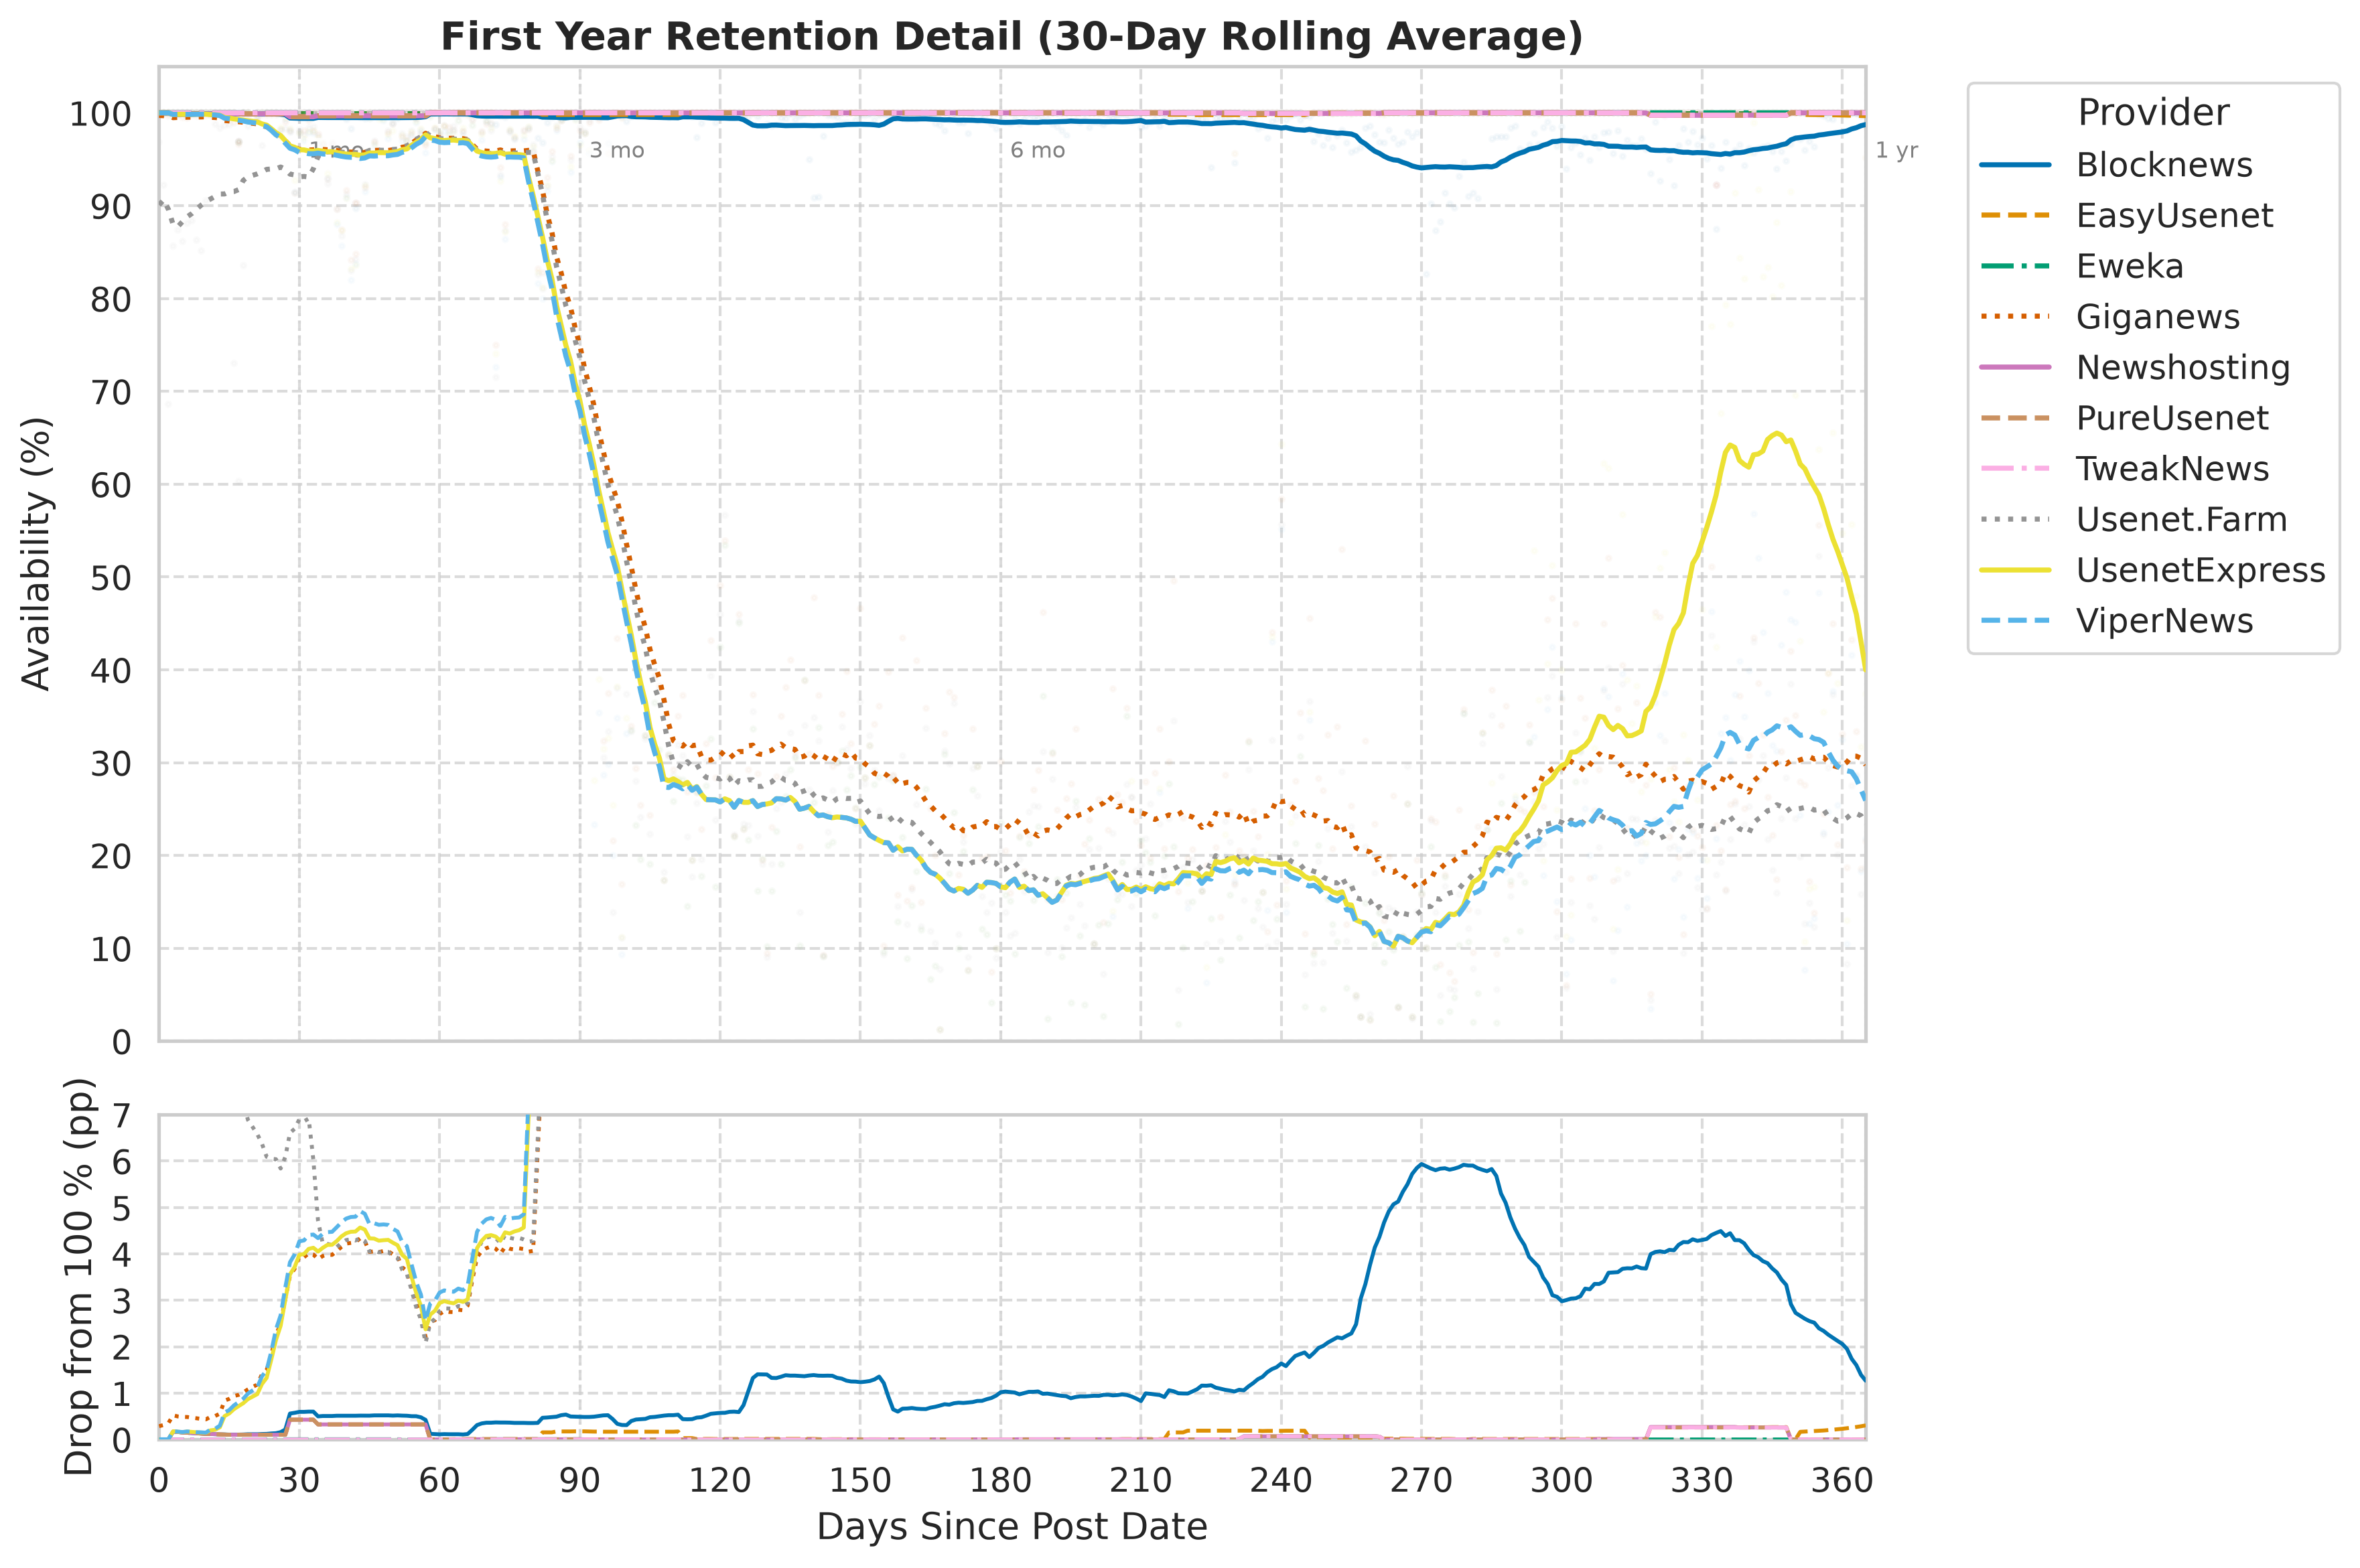
Bottom line: Four providers fall off a cliff within a single day just past three months of age; the others hold near 100% through the whole first year. At day 365, Eweka, Newshosting, PureUsenet, and TweakNews are at 100% in the daily view; EasyUsenet is about 95.22%; UsenetExpress is about 37.38%; Usenet.Farm is about 18.80%; and Giganews and ViperNews are about 21.50% and 21.84%. Blocknews is about 98.74% at day 365, despite a visible earlier dip.
How to read it: In the upper panel, higher means more sampled article bodies are available. In the lower panel, higher means a larger loss from perfect availability: a value of 4 means the smoothed availability is about four percentage points below 100%, not 4% availability.
This chart zooms into the first 365 days after posting.
The question underneath: during the first year after posting, how does sampled-segment availability change with each day of age, and how large are the short-term losses after roughly 30-day smoothing?
The code first groups stored rows by provider and whole-number article age in days. The upper panel then applies a centered 30-observation rolling average to those daily availability percentages; because the input is daily age data, this is presented as a 30-day rolling view. The faint points show the underlying daily values; the rolling line is intended to make the broader trend readable.
The vertical guides mark:
- 30 days / 1 month;
- 90 days / 3 months;
- 180 days / 6 months;
- 365 days / 1 year.
The lower panel plots:
100 − rolling average
in percentage points. A value of 4 in the lower panel means a four-percentage-point drop from 100%, not 4% availability.
This view makes small early losses visible that would be hard to see when all providers are pressed against the 100% ceiling. The chart shows a group that stays essentially flat, alongside providers with early dips and a more noticeable first-year decline. It is a detail view, not the 90-day horizon calculation: there is no qualification threshold or cutoff decision here.
What the first year actually shows. Two patterns stand out. In the first month after posting, availability is high almost everywhere: nine of the ten providers stayed at or above about 99%, several at essentially 100%, and only Usenet.Farm was materially lower at around 91%. Since most real downloads are of recent posts, that is the window most users actually live in—and inside it, provider choice barely matters. The differences that do appear are not gradual either. Giganews, UsenetExpress, and ViperNews hold roughly 96–99% through their first three months, and Usenet.Farm reaches the same range despite its weaker first month, before each of the four loses most of it within about a day: ViperNews falls from about 95.6% at day 92 to about 23.4% at day 93, UsenetExpress from 96.0% to about 28.1% at the same step, Giganews from about 99.2% at day 94 to about 32.4% at day 95, and Usenet.Farm from about 99.5% to about 30.5% across the same step. No other provider has a comparable one-day loss anywhere in the first year; the largest among the rest is about 11 points. That is a boundary rather than ordinary decay, and it is what produces the 90-day horizons in the age-based chart. The same transition appears in the first-year heatmap as the drop between the month-3 and month-4 cells. The test cannot determine why the boundary sits where it does.
Because the rolling window is centered and uses the available observations at the edges, the first and last part of the year should be read as a smoothed visual trend rather than as a separate confidence estimate.
6. First-year heatmap: month after posting, not calendar month
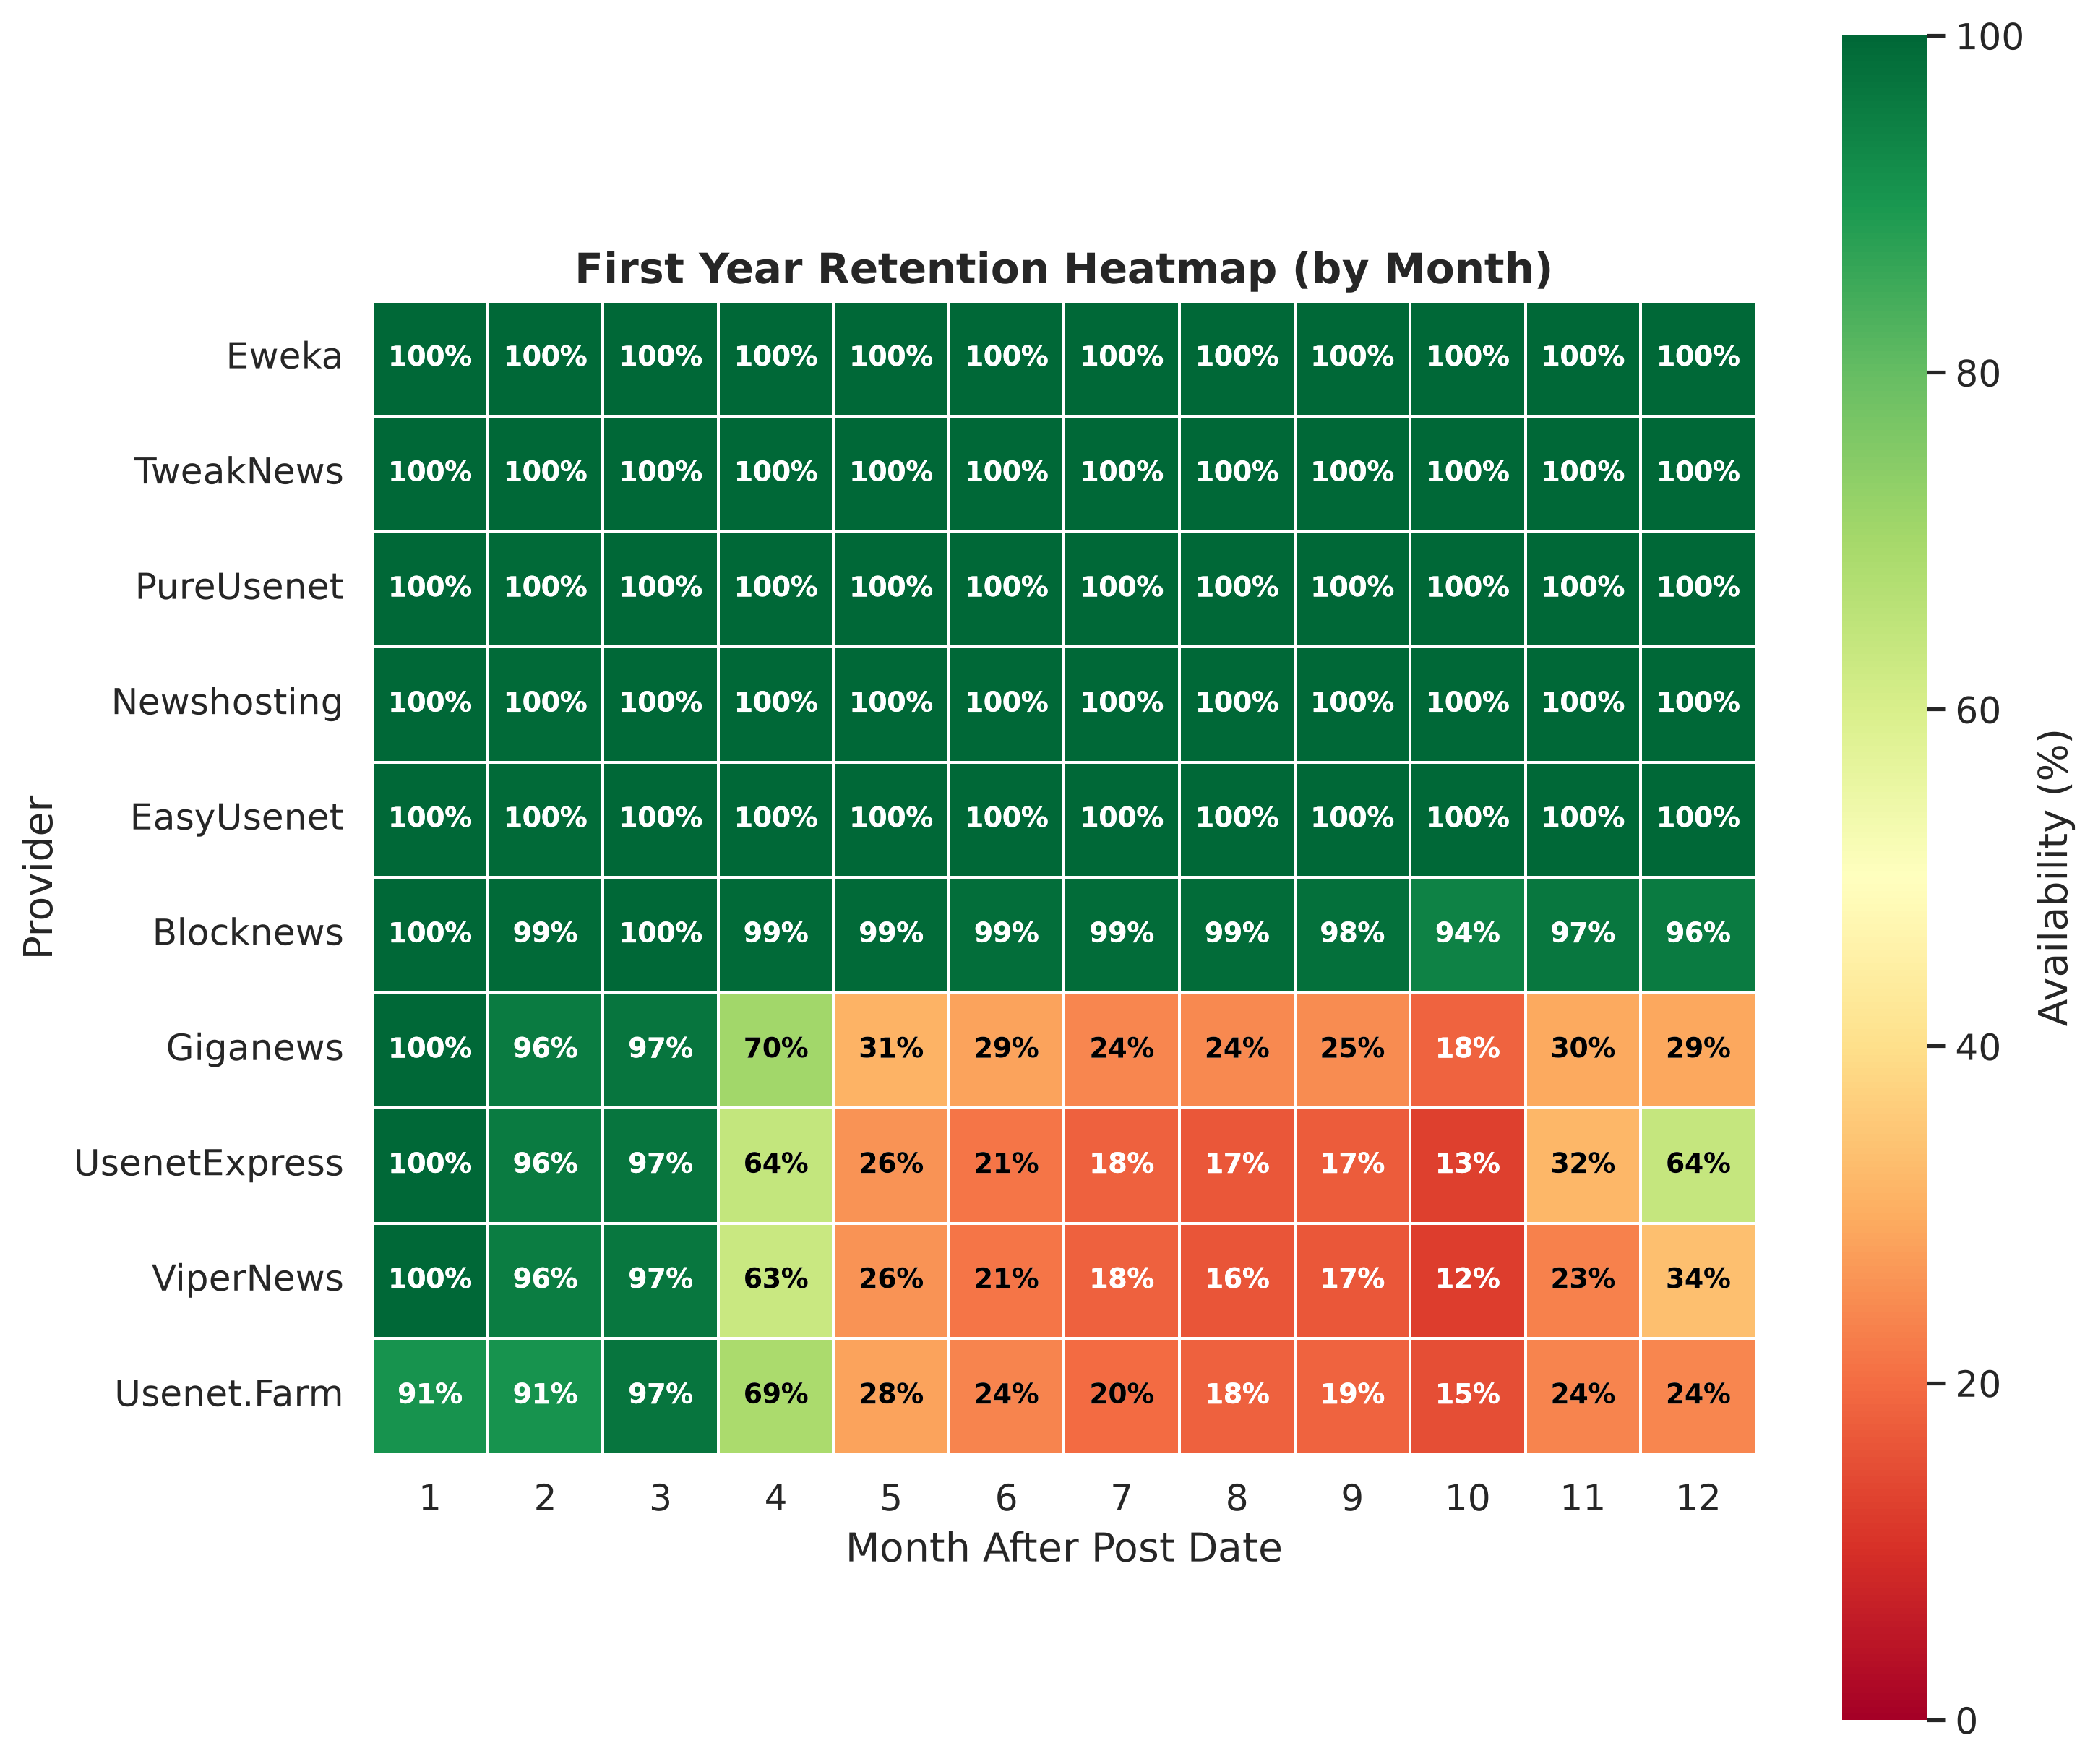
Bottom line: Five providers — Eweka, Newshosting, PureUsenet, TweakNews and EasyUsenet — hold at or near 100% for all twelve months, while the cliff group drops to roughly 20–35% from month 4 onward. By month 6, Giganews is about 28.51%, Usenet.Farm about 23.77%, and UsenetExpress and ViperNews about 21.36%; by month 12 they are about 29.12%, 24.09%, 63.92%, and 33.52%, respectively. Blocknews falls to 94.20% around month 10, then recovers to 95.75% by month 12.
How to read it: Read across one row to see how a provider changes as the same post-age increases. Read down one column to compare providers at approximately the same age. “Month 4” means roughly four months after posting—it does not mean April. Darker cells indicate lower availability.
This heatmap compresses the first year into twelve age-relative columns. “Month 4” means approximately the fourth month after the post date.
It answers a simple question: for each month after posting, what was the average sampled-segment availability on each provider?
The month number is calculated from whole-number article age using an average month length of 30.44 days. Each provider/month cell is the average availability of the rows assigned to that age-relative month. The labels are rounded to integer percentages for readability.
The chart shows:
- Eweka, TweakNews, PureUsenet, and Newshosting staying effectively at 100% across the first year.
- EasyUsenet also remaining close to 100% during this first-year view.
- Blocknews staying very high overall, with a visible dip to about 94% around month 10 and recovery in the following cells.
- Giganews, UsenetExpress, and ViperNews holding close to the top for the first three months and then dropping hard between the month-3 and month-4 cells.
- Usenet.Farm starting lower than the other providers and remaining in the lower group through the first year.
The Blocknews dip is a useful visual example of why the age-based horizon rule is not simply “the first cell below 95% equals the cutoff.” This heatmap itself is descriptive; the formal two-consecutive-buckets decision is made only from the 90-day age buckets.
7. Calendar heatmap: when the post was made
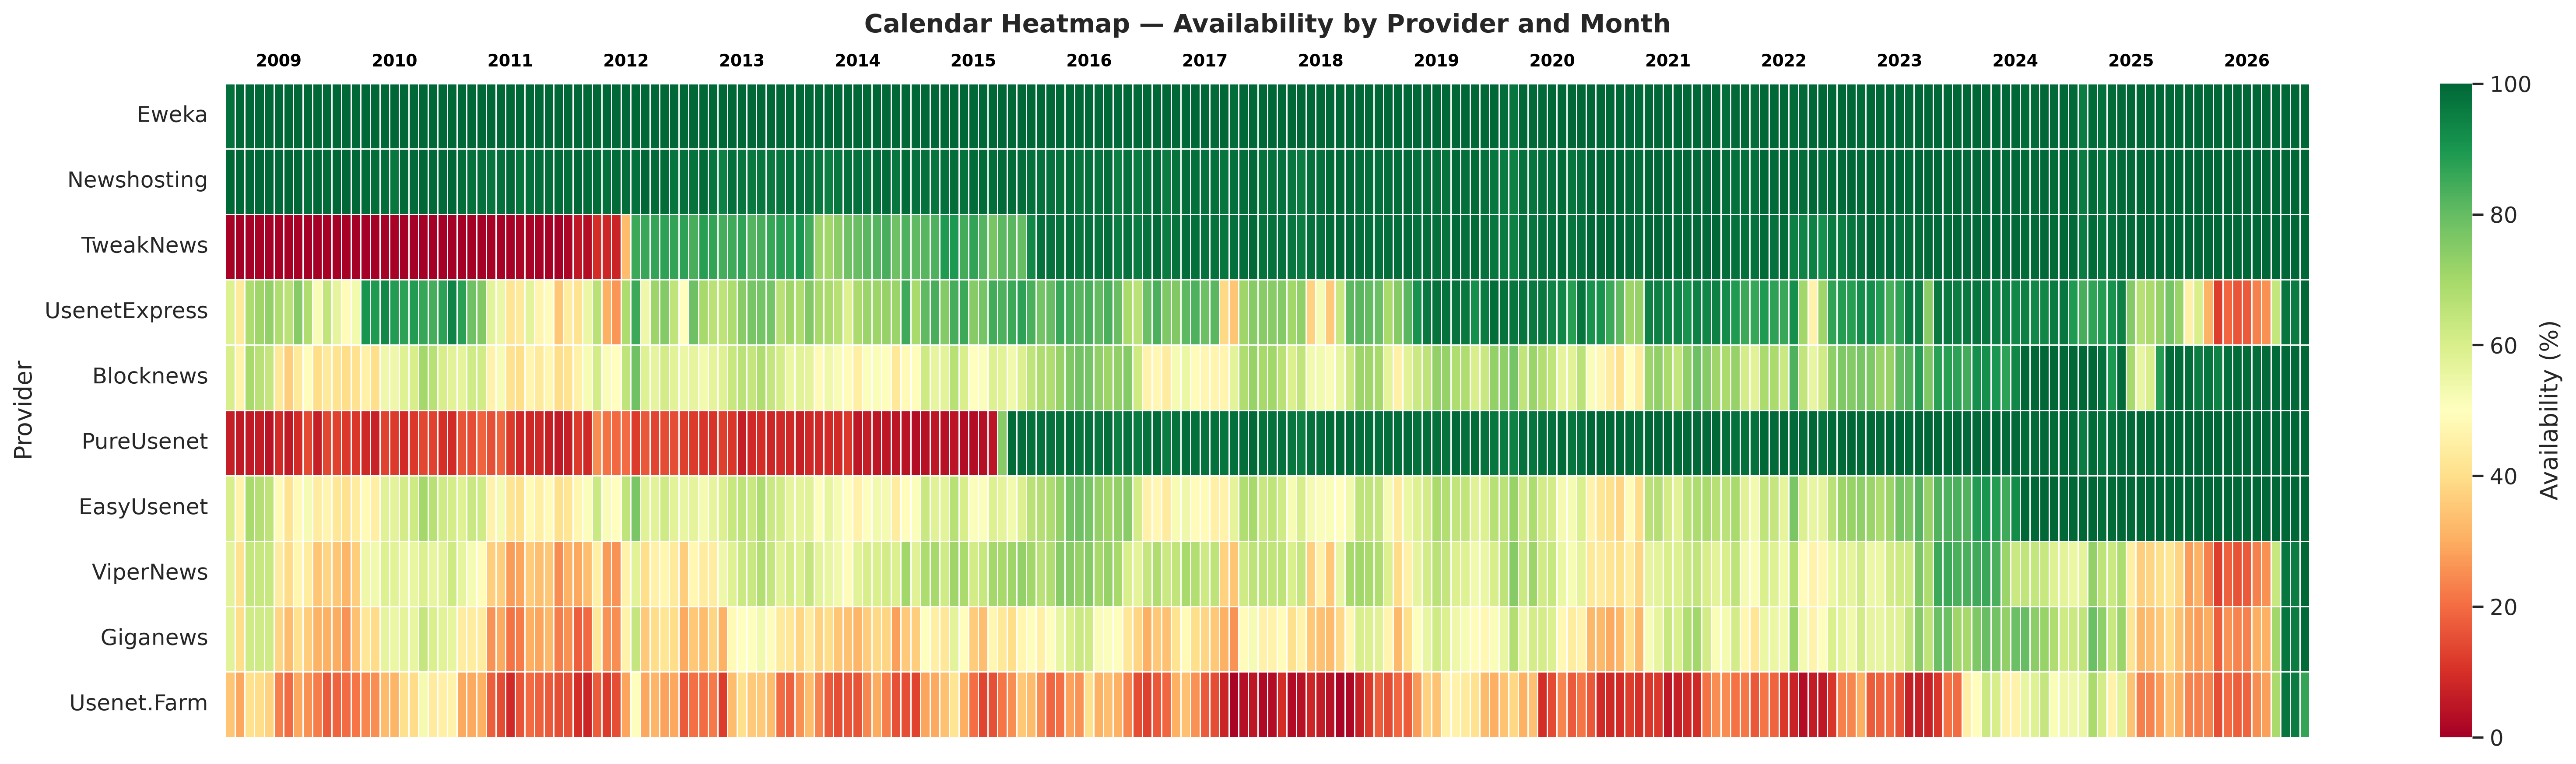
Bottom line: Some archives have sharp era boundaries, and this is the only chart that shows them. Read it across runs of adjacent calendar months, not isolated hand-picked dates. Persistent horizontal bands indicate that a provider’s results stayed in a similar range across an extended posting period; a sustained transition across several neighboring columns indicates that the observed composition of the archive changed over time. The transitions are real features of the measured sample, but they do not identify whether the cause was expiry, pruning, a storage change, a policy change, or a change in the sampled material.
How to read it: Read horizontally to follow one provider through calendar time and vertically to compare providers for the same posting period.
The question is plain: for NZBs posted in each calendar month, how much of their sampled content was still available when checked?
Here, the horizontal position is the calendar month in which the NZB was posted, not the age of the post when it was checked. The analysis first calculates daily availability by provider and post date, then groups those daily results into calendar months for the plot. The year labels are shown at January boundaries because displaying every month label would make the chart unreadable.
The chart makes historical eras and discontinuities visible. Some providers have long stretches of very high availability, while others show persistent low bands or transitions between high and low periods.
Definitions and detailed interpretation
How Usenet works, briefly
Usenet is not one service and has no central archive. A post is uploaded to a single news server as a set of separate articles; that server offers those articles to its peers, which offer them onward, and the material spreads outward across the network. Each operator then decides independently what to keep: how much of the incoming flow to store, for how long, on which media, and under which policy. Nothing in the protocol requires any server to retain any particular article, so retention is a property of each backbone rather than of Usenet as a whole. That is why two providers can show different availability for exactly the same article, which is the difference the charts in this article measure.
This server landscape is also far more concentrated than it once was. What began as a broad set of independently operated, mutually peering servers is now a small number of large commercial backbones that supply many retail brands. For a broader introduction to the network and its terminology, see Getting started.
Retention, binary posts, NZBs, and completion
In Usenet, retention means how long a provider keeps articles on its servers and makes them accessible to users. A number such as “5,000 days of retention” is a broad age claim, not a guarantee that every article posted within those 5,000 days still exists or that every download containing it will complete.
There is an important distinction between text retention and binary retention:
- Text retention is the availability of ordinary text-based posts, such as discussion messages. These are small and are often retained for longer.
- Binary retention is the availability of file content—such as images, video, software, or archives—posted as many Usenet articles. Binary content requires much more storage and is usually the retention figure relevant to people downloading files.
This test is purely about binary retention. Its input is a collection of real NZB files describing binary posts. It does not test ordinary text articles, discussion groups, or text retention. A provider can therefore have a much longer advertised text retention without that telling us how well its older binary articles will download.
What an NZB file and a segment are
An NZB file is an XML map for a Usenet download; it is not the downloaded file itself. When a binary file is posted, it is split into many smaller pieces and each piece is published as a separate NNTP article. The NZB records the references needed by a newsreader—most importantly the Message-ID for each article and the order in which the pieces belong. A downloader reads the NZB, requests those articles from a provider, and reassembles and decodes the pieces into the original file or files.
In this article, a segment means one of those referenced pieces: one <segment> entry in the NZB pointing to one NNTP article. An NZB can contain hundreds or thousands of segments, and can describe multiple files, so one segment is only a small part of the eventual download. The test samples up to 100 segment references from each NZB rather than downloading every segment in every file.
Retention is not completion
These are related but different questions:
- Retention: “Can this individual sampled segment’s article body still be retrieved from the provider today?”
- Completion: “Can the entire NZB be downloaded, decoded, and reconstructed successfully?”
Without recovery data, a complete NZB normally needs every required data segment. If some segments are missing, PAR2 recovery blocks may be able to reconstruct them; if too many are missing, the download remains incomplete. Therefore, a high percentage of available sampled segments does not equal the same percentage of completed NZBs: the missing segments may be among the segments that were not sampled, and the test does not download every segment or evaluate PAR2 repair. Conversely, a download with some missing segments can still complete if its recovery files contain enough redundancy.
Retention and completion are nevertheless correlated. If a provider has poor binary retention, more of the segments needed by an NZB are likely to be missing, so the probability of downloading and reconstructing that NZB generally gets worse. For a large NZB, even a modest per-segment loss can matter because it only takes a small number of unrecoverable missing segments to prevent completion. The relationship is not one-to-one: segment losses may be repairable with PAR2, some sampled losses may not affect a particular NZB, and fallback providers can supply missing articles. In short, retention is not completion, but bad retention is still a strong warning sign for bad completion.
The percentages in this article are therefore segment-retention probabilities, not NZB completion rates.
Implications for users, providers, and the Usenet community
The measurements directly answer a narrow question: whether sampled binary segments were still retrievable from each provider when tested. The broader points in this section are interpretations of what that means for users, providers, and long-term preservation; they are not additional measurements made by this test.
For users choosing a subscription
Retention is highly age-dependent. The charts show why a single advertised retention number is not enough. Many providers look almost identical for recent posts. The differences become much more important when the download is months or years old.
Choose the chart that matches the content you actually download:
- For a rough answer about a particular publication year, use Retention over years.
- For a direct age comparison, use Age-based retention.
- For the first year, use the first-year detail and first-year heatmap.
- For historical changes in a provider’s stored material, use the Calendar heatmap.
- For a relative comparison against the best result, use Provider delta.
Advertised retention is an age ceiling, not an availability rate. Providers quote retention in days: Eweka advertises 6,607 days, Newshosting 6,610+ days, TweakNews 5,000 days, and most other services land between 4,000 and 5,500 days. Those claims were captured on 20 September 2026, about seven weeks after this test finished, so they describe what the providers advertise now rather than what was published while the run was in progress. The table places each claim next to the sampled binary availability in the 90-day bucket that spans the claimed age.
| Provider | Advertised retention (source) | Claimed age | Measured availability in that bucket |
|---|---|---|---|
| Eweka | “6607 Days Article Retention” | 6,607 days | 99.9% |
| Newshosting | “6610+ Days Article Retention” | 6,610 days | 99.9% |
| PureUsenet | “4100 Days Retention” | 4,100 days | 99.1% |
| TweakNews | “5,000 Days of Article Retention” | 5,000 days | 85.3% |
| EasyUsenet | “EasyUsenet offers 4000+ days of binary retention across groups” | 4,000 days | 69.6% |
| Blocknews | “Netnews backbone, 5,500 +/- days retention” | ~5,500 days | 43.2% |
| UsenetExpress | “Many Articles Over 4000 Days Old” | 4,000 days | 80.6% |
| ViperNews | “Our platform currently retains Usenet messages that are more than 4,500 days old” | 4,500 days | 59.6% |
| Giganews | “Over 5 Years of Binaries” | ~1,825 days | 54.7% |
| Usenet.Farm | “3000+days on text completion”, binaries stored “as long as possible” | no binary age named | 7.4% at 3,000 days (context only) |
Eweka’s and Newshosting’s advertised ages sit just beyond the oldest post this sample can contain, so both are compared against the oldest measured bucket; there is no older material in the sample to test, which makes their values a floor rather than a ceiling. The measured column uses the 90-day bucket that spans the claimed age — 3,960–4,050 days for a 4,000-day claim, for example — so each value is a bucket average rather than a measurement at one exact age.
The table maps an advertised age onto what was measured at that age; it is not a ranking of honesty. Three qualifications matter:
- An age ceiling is not an availability rate. “Up to X days” describes the oldest age a provider intends to cover, not the share of material still present at that age, and the 95% rule behind the horizons is this test’s convention rather than anything a provider promises.
- The measurements are retrospective; the claims are current. The sample was checked in July 2026 but contains posts published long before that, so gaps in older cohorts may come from migrations, tiering, pruning, takedowns, or the composition of the sampled material rather than from present-day policy.
- The wording differs enough that not every row is comparable. Usenet.Farm promises text completion and only “as long as possible” for binaries, UsenetExpress says “many articles”, ViperNews says “messages … more than 4,500 days old”, the Blocknews figure comes from a community discussion rather than a provider page, and Giganews additionally claims “100% newsgroup article completion … whether the article was posted 30 days or 3,000 days ago”, where the measured binary availability at 3,000 days was 56.2%.
Read alongside the age-based chart, some claims line up closely with the measurement while others describe an age that the sampled archive only partly reaches.
How much does a second provider add?
The practical answer. If the material you care about is older than a year, pair a long-retention service with one from a different owner: Eweka plus Blocknews was the strongest pairing in every age band, with EasyUsenet usually within about a tenth of a point of it, and past ten years no pairing came close without Eweka or Newshosting. For recent material a second account buys resilience rather than coverage.
Backbone diversity is usually more useful than collecting brand names, and this run can measure it rather than only assert it. For a second subscription, what decides the benefit is not only how much the partner keeps, but whether it fails on the same posts. Because every sampled segment was checked against all ten services in the same July 2026 run, the sample can answer that directly: when one provider could not deliver a segment, how often was that same segment missing on the other, and how many more sampled NZBs the two of them cover together than the better one covers alone?
A pair covers a sampled NZB when every sampled segment of that NZB was available on at least one of the two services. That is not a completion rate: it ignores PAR2 repair and it looks only at the sampled segments. It is still the closest thing this dataset has to the question a buyer is asking, which is whether the second account would actually rescue the download. In the pairing table below, the number after each candidate is the share of sampled NZBs the pair covers together, so what the partner adds is the difference from the Covered alone figure in the same row.
How much a second account can add depends on the age of the material:
| Age of material | Best single service | Covered alone | Best pairing | Covered together |
|---|---|---|---|---|
| under 1 year | TweakNews | 99.89% | Eweka + Blocknews | 100.00% |
| 1–5 years | Eweka | 97.23% | Eweka + Blocknews | 99.94% |
| 5–10 years | Eweka | 98.33% | Eweka + Blocknews | 99.68% |
| over 10 years | Eweka | 99.07% | Eweka + Blocknews | 99.91% |
In every band the best partner in this sample came from outside the top group, and the benefit came from failing on different posts rather than from matching the first service's retention.
- Under a year, a second account changes almost nothing about coverage: the best pairing of two services that both score above 99% in that band added less than 0.2 percentage points. What it buys instead is resilience to an outage and a second route around individual missing articles or takedowns.
- From one to ten years, the pairing is what matters, and the useful question is which backbone the second account reaches.
- Beyond ten years, no pairing got close to a long-retention store unless Eweka or Newshosting was one of the two. The best pairing in that oldest band that contained neither (TweakNews + UsenetExpress) covered 53.74% of sampled posts, against 97.47% for Newshosting alone and 99.07% for Eweka alone, and adding a partner to one of those two was worth at most 0.88 percentage points.
In the 1–5 year band, where most of the pairing benefit sits, the five strongest second accounts depended on what was already in the account:
| Already have | Covered alone | Strongest second accounts |
|---|---|---|
| Usenet.Farm | 1.75% | Eweka 97.88% · PureUsenet 97.60% · Newshosting 97.54% · TweakNews 92.14% · EasyUsenet 62.06% |
| ViperNews | 17.09% | Eweka 98.85% · PureUsenet 98.62% · Newshosting 98.56% · TweakNews 94.03% · EasyUsenet 64.10% |
| Giganews | 17.52% | Eweka 99.27% · PureUsenet 99.00% · Newshosting 98.95% · TweakNews 94.33% · EasyUsenet 62.94% |
| UsenetExpress | 37.65% | Eweka 98.88% · PureUsenet 98.63% · Newshosting 98.61% · TweakNews 96.59% · EasyUsenet 76.65% |
| Blocknews | 49.46% | Eweka 99.94% · PureUsenet 99.69% · Newshosting 99.67% · TweakNews 95.53% · UsenetExpress 67.85% |
| EasyUsenet | 61.65% | Eweka 99.93% · PureUsenet 99.61% · Newshosting 99.58% · TweakNews 95.43% · UsenetExpress 76.65% |
| TweakNews | 91.46% | Eweka 97.25% · Newshosting 96.93% · PureUsenet 96.93% · UsenetExpress 96.59% · Blocknews 95.53% |
| Newshosting | 96.84% | Blocknews 99.67% · EasyUsenet 99.58% · Giganews 98.95% · UsenetExpress 98.61% · ViperNews 98.56% |
| PureUsenet | 96.91% | Blocknews 99.69% · EasyUsenet 99.61% · Giganews 99.00% · UsenetExpress 98.63% · ViperNews 98.62% |
| Eweka | 97.23% | Blocknews 99.94% · EasyUsenet 99.93% · Giganews 99.27% · UsenetExpress 98.88% · ViperNews 98.85% |
What a second account adds depends far more on whether the partner loses the same material than on how strong the partner is. The services that score highest in the age-based chart are also the ones that fail together: in this band, 97% of the segments Eweka could not deliver were missing from Newshosting, PureUsenet and TweakNews as well. Adding one of them therefore moved coverage by at most 0.04 percentage points, while a service from outside that group that keeps far less overall moved it by 1.6 to 2.7 points.
Three patterns explain the table:
- The candidate order is an ownership pattern. The five candidates in each row are ordered by what the pair covers together, and the names run along ownership lines: Eweka, Newshosting, PureUsenet and TweakNews are all owned by Omicron Media, so for any service outside the group the first four candidates come from a single owner and the fifth is the first option owned by someone else.
- Below the group, the leading options are interchangeable. For a service below the group the first three sit within about a third of a point of one another — close enough that the order shifts between age bands and that price, speed or capacity should decide instead — while the fourth already drops two to five and a half points and the fifth another nineteen to thirty-one.
- Inside the group, a sibling adds almost nothing. For the group members themselves the five candidates sit within about 1.1 points of each other (1.7 for TweakNews), and for Eweka, Newshosting and PureUsenet not a single Omicron sibling makes the top five, because adding one would rescue almost nothing; TweakNews, the weakest of the four, still gains five to six points from each.
The measured sharing therefore lines up with ownership rather than with the backbone labels shown in the reference table, where Eweka appears under its own name and TweakNews under Base IP. The test can show that failure sets coincide without establishing the mechanism: shared storage, a shared upstream, mirroring, or a common operating policy under one owner would all look alike from the outside. The sharing also weakens at the oldest ages, where a partner no longer holds the material at all.
The first-year band needs care, and not because of one provider. Usenet.Farm, ViperNews, Giganews and UsenetExpress all lose most of their material around the 90-day mark, so each of their first-year figures blends a nearly complete recent buffer with a much thinner archive. At post level they separate from the rest rather than from each other: alone they covered 19.46% of the sampled first-year NZBs (Usenet.Farm, 42.65% of sampled segments), 21.04% (ViperNews, 43.01%), 22.25% (Giganews, 47.13%) and 23.01% (UsenetExpress, 46.99%). Pairing two of them barely helps — the best combination inside that group reached 28.70% — while pairing any of them with a service from outside the group reached 99.91% or better. A single first-year average therefore says little about either end of that band; the first-year detail chart and the heatmap show where the step sits.
Two limits are worth keeping in mind. These are sample results — roughly 12 NZBs per posting day — so a few posting days can move a band average, and a difference of a few tenths of a point should not be read as stable precision. And a pairing can only compensate for storage that is missing: if a post was removed network-wide, never fully propagated, or filtered at ingest everywhere, a second account does not bring it back. Completion also depends on the poster, group, indexer, article size, takedown handling, repair files, and client configuration. The measurement itself is documented below, so it can be reproduced, extended, or contradicted.
These results are not necessarily your results. Your experience can differ because:
- your indexer selects different posts;
- your downloads have a different age distribution;
- your files come from different groups, posters, or content types;
- your client uses fallback providers differently;
- your account accesses another region or plan;
- the provider changes its storage, filtering, or takedown behavior after this test.
The percentages describe this measured population and this test period. They are not a promise about every NZB.
For providers
For providers, the results illustrate why one advertised retention number is an incomplete description of a large article store. Users need to tell text from binary retention, recent from historical availability, a temporary transfer failure from a real loss, and metadata that survives from a body that does not. Reporting those distinctions would make retention claims far more comparable.
Long-term binary retention is also an operational promise, not only a marketing number. It requires capacity planning, redundancy, integrity checks, drive replacement, rebuilds, migrations, power, cooling, network capacity, staffing, and a sustainable way to pay for all of it. This test cannot identify which of those factors caused a particular provider’s curve to fall, but it shows why a provider can store most accepted content initially and still face difficult choices as the archive grows.
For the Usenet community
For the community, the results are a reminder that many retail names do not necessarily represent many independent archives. Services may share a backbone, storage platform, operator, or policy, so a different brand does not automatically provide an independent copy of an article; the pairing comparison above puts a number on that overlap of failures. Reproducible tests, clear terminology, and public explanations of methodology make it easier to distinguish genuine infrastructure diversity from brand diversity.
Delivering content while it is new is not the same as long-term preservation.
Distributed delivery is not the same as long-term preservation
An NZB is a retrieval map, not an archive. It identifies the articles needed to reconstruct a download, but it cannot replace the article bodies if those bodies disappear. The same distinction applies at four levels:
- Reachability: can an individual article body be retrieved today? This is what this test measures for sampled binary segments.
- Completion: can the whole NZB be downloaded, decoded, repaired, and reconstructed? This test does not measure it.
- Integrity: are the retrieved bytes complete and unchanged? This test does not establish that either.
- Preservation: will independent copies, metadata, and the ability to read them survive future failures, policy changes, and technology migrations? This test cannot predict that.
Copies on several servers are valuable, but they are not necessarily independent copies. If those servers share a backbone, operator, storage platform, retention policy, legal dependency, or geographic failure domain, a single decision or failure can affect all of them. Part of that redundancy used to be implicit: when the network was made up of many independently operated servers that exchanged material with one another, copies accumulated across different operators by default. As storage concentrated into a few commercial platforms, keeping historical material became a deliberate business decision with a recurring cost, which is exactly the kind of decision that can be revised later.
For important material, durable preservation therefore means more than keeping an NZB or relying on a provider account. It means obtaining and verifying the completed files, preserving the NZB and PAR2 data where relevant, retaining useful metadata and checksums, and maintaining copies under independent control. A long-term archive also needs periodic integrity checks, tested restores, migration plans, and a sustainable source of storage and operational funding.
The lesson extends beyond Usenet to other decentralized or federated communication platforms. A platform designed for distributed delivery should make export possible, preserve manifests and provenance, describe its lifecycle and deletion policies, and make independent replication practical. “Decentralized” should not be treated as a guarantee of permanence: durable preservation requires explicit technical, economic, and governance choices.
Deep dive: why providers diverge
This is an optional infrastructure deep dive. It explains how providers can diverge after common ingest and why maintaining long-term binary storage is difficult; readers interested mainly in the results can skip to the technical methodology or reference sections.
The charts show that providers can have very different availability for the same historical material. They do not, by themselves, identify one single cause. All ten providers tested here receive the same broad feed, but that does not mean every byte—or every spam, abuse, or otherwise filtered post—reaches every storage system or remains there. The meaningful divergence happens at and after common ingest: which articles are accepted, how long they remain online, what is pruned or removed, and how the storage system is operated. Retaining the accepted portion of that feed for many years requires enormous storage, redundancy, power, and ongoing investment.
Historical feed growth and the storage scale
As useful context, NewsDemon’s historical feed-size page publishes the following daily incoming-volume snapshots. The table below reproduces only figures shown on that page; it does not contain interpolated values or derived storage totals.
| Daily volume | Date |
|---|---|
| 27.80 TiB | 2017 Jan |
| 37.35 TiB | 2018 Jan |
| 60.38 TiB | 2019 Jan |
| 62.40 TiB | 2020 Jan |
| 100.71 TiB | 2021 Jan |
| 147.9 TiB | 2022 Sep |
| 156.6 TiB | 2022 Oct |
| 160.3 TiB | 2022 Nov |
| 196 TiB | 2023 Feb |
| 220 TiB | 2023 Aug |
| 300 TiB | 2024 Mar |
| 365 TiB | 2024 Jul |
| 475 TiB | 2024 Nov |
| 500 TiB | 2025 June |
These are incoming-feed figures, not retention figures and not a claim about how much a provider ultimately keeps. They show why projecting today’s volume backward would be misleading: the feed was measured in only a few TiB per day at the early end of the published timeline, not hundreds of TB per day.
A rough accumulated-volume illustration
The published historical snapshots in the table can still be used to show the order of magnitude involved. For the calculation only, I use the newer 2026 feed-size estimate of approximately 400–600 TB of new articles per day for the portion from January through July 2026. Treating each historical snapshot as representative of the interval until the next one, linearly interpolating between the dated points, starting in August 2008, and extending through the end of July 2026 gives approximately 0.6–0.8 EiB of raw incoming feed—roughly 0.7–0.9 EB in decimal units—over the period.
This is a deliberately broad calculation from sparse snapshots, not a NewsDemon figure and not a measurement of any provider’s archive. It assumes a smooth change between published points and treats all incoming volume as if it were accepted input. In reality, spam, abuse, malformed articles, duplicates, and policy-excluded material may never enter long-term storage, while replication, parity, indexes, ingest buffers, backups, and spares require additional capacity. Providers can also expire older data, so cumulative incoming volume is not necessarily simultaneous stored volume. It is nevertheless a useful scale estimate for a provider that keeps most accepted articles for many years.
A useful way to understand the scale is to imagine what it could mean for capacity if roughly that accumulated input had to be accommodated at once. Rather than assuming today’s largest HDDs, use a deliberately rough mixed-fleet assumption of 10–16 TB per disk, using the decimal TB units used by drive manufacturers. That better represents a store built up over many years; it is an assumption for this illustration, not a claim about any provider’s actual hardware. This is also why the calculation does not treat 26TB drives as the standard: that capacity is a newer upper-end option, not a sensible default for a fleet accumulated over the period under discussion. For a concrete enclosure reference, Supermicro documents a 4U storage system with 36 hot-swap 3.5-inch SAS/SATA bays, while Backblaze describes 4U storage pods with 45, and later 60, drive positions. Designs vary, but the order of magnitude is clear. 0.6–0.8 EiB of raw data would require roughly:
- roughly 43,000–58,000 HDDs at 16TB per disk;
- roughly 58,000–77,000 HDDs at 12TB per disk;
- roughly 69,000–92,000 HDDs at 10TB per disk;
- 1,200–2,600 fully populated 36-bay 4U storage systems for the 10–16TB endpoint range;
- about 120–260 42U racks if ten 4U systems fit in each rack, before allowing space for networking, power, cooling, spares, or staff access.
A different 4U design changes the enclosure count but not the underlying scale. For example, a 45-drive 4U pod would require roughly 950–2,050 enclosures for the same raw-capacity range. These figures are theoretical raw-capacity counts: they assume every bay contains a data disk and exclude filesystem or RAID/parity overhead, hot spares, cache and controller storage, ingest buffers, replication, backups, and replacement capacity. A 12TB mixed-fleet example lands around 1,600–2,200 36-bay systems, or roughly 160–215 racks on the same ten-per-rack assumption. Those are storage servers only. A production provider would also need separate or shared ingest, index/database, control, monitoring, authentication, and network equipment; their quantity and footprint cannot be inferred from feed volume alone.
For a rough media-cost check, TrendForce reported average HDD pricing moving from about $0.012–0.013/GB to $0.015–0.016/GB in 2025. Applying the latter range to roughly 0.7–0.9 EB of decimal capacity suggests approximately $10–15 million for the drive media alone for one raw copy. This is a current replacement-cost yardstick, not what providers necessarily paid: a real fleet would have been purchased over many years, with older 10–16TB generations, different vendor prices, repairs, and replacements. The estimate excludes chassis, controllers, networking, racks, power, cooling, replacements, labor, and redundancy; two complete copies would roughly double the media, chassis, and rack requirements. The calculation illustrates why a provider can store most of the accepted feed initially while still facing difficult economic and engineering choices as the archive ages.
Storage, hardware, power, and capacity limits
Providers generally store most accepted articles for at least an initial period. The long-term challenge is how long those articles remain available after ingest and how the provider keeps the growing store online.
As stored data ages, a provider has to continuously add capacity while also replacing failed drives, rebuilding redundancy, migrating data, and keeping enough headroom for new ingest. Those are engineering limits as much as accounting entries. A provider can therefore have excellent recent retention while older material is trimmed, moved to a cheaper or less accessible tier, or lost during a migration or rebuild.
Storage hardware has also not become an unlimited cheap resource. Recent TrendForce reporting describes rising HDD costs during the industry’s more expensive transition to HAMR, while a separate report describes nearline-HDD shortages and lead times exceeding 52 weeks. These are market context, not a measurement of any provider’s invoice or proof of why a particular curve falls, but they show why expanding a very large archive can become more expensive or slower precisely when the feed is growing.
Disk shelves are not the only cost. Electricity, cooling, racks, networking, controllers, staff, data-center space, and redundancy all scale with the archive. The IEA’s Energy and AI analysis reports that data centers used about 415 TWh globally in 2024 and projects that their electricity use could more than double by 2030. That is not Usenet-specific, but it is a useful reminder that storage infrastructure competes for constrained power and data-center capacity too.
These economics can be particularly difficult for smaller providers. Storage, feed connectivity, redundancy, support, and engineering have substantial fixed costs that do not shrink in proportion to the number of subscribers. Larger operators can spread those costs across more customers and may have better access to hardware, facilities, and network capacity. A smaller provider that cannot invest at the same pace may have to limit retention, redundancy, or operating headroom; that can make the service less competitive, potentially causing customers to leave and making the fixed costs even harder to carry. In that sense, high infrastructure costs can create a self-reinforcing cycle of fewer customers, less investment, and weaker service.
This is an economic possibility, not a conclusion about any particular provider. Smaller providers can also use shared backbone infrastructure, focus on a niche, control costs effectively, or offer other advantages. The test cannot determine whether this cycle affected any specific curve, but it helps explain why scale can matter so much in a storage-intensive market.
Operational differences after ingest
Several providers can therefore make different, rational choices after receiving the same broad feed:
- Initial acceptance and filtering: Spam, abuse, malformed posts, duplicate material, and articles excluded by policy may never enter the long-term store. A common feed does not imply identical byte-for-byte archives.
- Expiry and pruning: Older binary data may be deleted when it reaches a practical retention boundary, or selectively pruned to preserve capacity for new ingest. A provider may keep most of the feed initially and still show a large historical gap later.
- Replication and operations: Multiple copies improve resilience but multiply storage needs. A provider may choose more redundancy, faster repair, or a smaller operational buffer; disk failures, migrations, and rebuilds can leave different historical gaps.
- Filtering and legal policy: Takedown requests, abuse handling, spam controls, and local legal obligations can remove articles selectively. In this test, a 451 response is treated as an unavailable article, but the chart cannot distinguish why a particular article was removed.
- Commercial constraints: Prices, customer demand, capital budgets, account tiers, and risk tolerance influence how aggressively a provider expands storage and redundancy. Related retail services can share infrastructure without having identical historical stores.
- Time-dependent changes: Ownership, hardware generations, storage tiers, server locations, and policies can change. A provider’s current performance is not necessarily a description of every year in its history.
This also explains why the shape of a curve is suggestive but not diagnostic. A sharp cliff may be consistent with an expiry policy, a pruning event, a storage migration, or a takedown wave. A gradual decline may reflect accumulated deletions, selective removals, or several operational changes over time. Only provider-side historical records could establish the cause.
Finally, these tests add another layer of uncertainty: they sample real NZB files rather than the complete feed. Different groups, posters, article sizes, indexers, and dates may produce different results.
Taken together, these possibilities mean the curves describe what survived in this sample, not a single cause or a provider’s private retention policy.
Technical methodology
What “available” means here
The unit checked is one of the sampled segments described above. For each provider, the test records a Boolean result:
- an NNTP 2xx
ARTICLEresponse is available; - an article-not-found or article-removed response is unavailable;
- a connection or other probe error is recorded with its status and handled according to the analysis filter used by the particular graph.
1. Parse the NZB files
Each NZB is parsed as XML: the segment Message-IDs are extracted in document order, along with the first parseable date attribute on a <file> element.
2. Select a deterministic segment sample
The random, time-balanced selection described above applies to the NZB corpus. It should not be confused with the selection of segments inside each chosen NZB. Once an NZB is included, a deterministic method selects up to 100 of its segment references. The same NZB therefore produces the same segment sample every time with the same sample-size setting.
- If an NZB has 100 segments or fewer, all of them are checked.
- If it has more, the sampler chooses positions evenly across the complete list.
- The first and last segment are therefore included, as are evenly spaced positions through the middle.
3. Check every selected segment on every provider
Each Message-ID is normalized and checked through an authenticated, pooled NNTP connection. The availability probe deliberately uses the ARTICLE command rather than STAT or HEAD.
STAT and HEAD are metadata-only commands: STAT asks the server to identify an article, while HEAD asks for headers such as Date, Subject, and Message-ID. Those responses can sometimes remain positive even when the article body—the part a downloader actually needs—has already been removed or is no longer retrievable. A header that still exists is therefore not enough evidence that the segment can be downloaded.
ARTICLE requests the body itself. The probe drains that body completely into a temporary in-memory sink and discards it after the response has been classified. This means the test checks the thing that matters for a real download: whether the provider can deliver the segment body, not merely whether it can return metadata about it. A successful 2xx response is the availability signal. The expected retention misses are status 430 (“no such article”) and 451 (“article removed”); both count as unavailable when they are included in a retention calculation. A broken or incomplete body transfer is treated as a transient probe failure, retried with a replacement connection (up to three attempts in total), and excluded by the retention analysis rather than being mistaken for either a successful download or a retention loss.
Checks are performed concurrently. The connection pools, sliding windows, and retries affect how long the run takes, but not the intended definition of an available segment.
Reference
Providers, backbones, and equivalent services
This section is the reference for the backbone relationships and equivalent services represented in the test.
For context, see Backbones. In this context, a backbone is the central Usenet network and storage platform: the high-capacity servers, article storage, and network/peering infrastructure that receive, retain, synchronize, and distribute Usenet articles. A backbone can power a provider directly or provide the infrastructure used by several retail providers and resellers. Different retail names can therefore share much of the same underlying article store, although their endpoints, plans, and operational choices can still differ.
The Usenet Tree is the reference for current relationships. The table below is a practical guide to related services, not a claim that every service in a row has identical retention, policies, locations, or performance. Provider relationships can change, so the map should be checked before buying an account.
| Tested provider | Backbone shown in current provider maps | Related or equivalent services worth comparing |
|---|---|---|
| Eweka | Eweka Internet Services | N/A |
| Newshosting | Omicron (US/NL) | EasyNews, Usenetserver, Newsgroup Ninja |
| PureUsenet | Omicron (NL) | SunnyUsenet, XLned |
| TweakNews | Base IP | N/A |
| EasyUsenet | Abavia | XS News, StingyUsenet, TurboUsenet, UsenetAgency, UseNight, Usenetdeal, NewsXS, HitNews, Bulknews, CheapNews |
| UsenetExpress | UsenetExpress | NewsDemon, NewsgroupDirect, UsenetPrime, theCubeNet, ThunderNews |
| ViperNews | Uzo Reto | N/A |
| Blocknews | NetNews | Frugal Usenet, UsenetNow |
| Giganews | Giganews | Supernews |
| Usenet.Farm | Its Hosted | N/A |
Ownership can cut across those map labels: Eweka, Newshosting, PureUsenet and TweakNews are all owned by Omicron Media, even though current maps show Eweka under its own name, TweakNews under Base IP, and only Newshosting and PureUsenet under Omicron itself. Newshosting and PureUsenet represent different platforms and regions of that backbone (US/NL versus NL), which is why both appear even though the selection otherwise aims for one representative per backbone.
“Equivalent” here means “potentially overlapping underlying network access,” not “guaranteed identical result.” A regional endpoint, storage tier, takedown policy, account plan, or reseller arrangement can make two names behave differently. Conversely, two accounts that look different in a shopping cart may add very little redundancy if they ultimately reach the same backbone.
News servers used for the test
These are the exact NNTP endpoints in the test configuration. All ten were configured for encrypted NNTP on port 563.
| Provider | NNTP server | Port | Transport |
|---|---|---|---|
| Eweka | news.eweka.nl | 563 | TLS/SSL |
| Newshosting | news.newshosting.com | 563 | TLS/SSL |
| PureUsenet | news.pureusenet.nl | 563 | TLS/SSL |
| TweakNews | news.tweaknews.eu | 563 | TLS/SSL |
| EasyUsenet | reader.easyusenet.nl | 563 | TLS/SSL |
| UsenetExpress | news.usenetexpress.com | 563 | TLS/SSL |
| ViperNews | news.vipernews.com | 563 | TLS/SSL |
| Blocknews | eunews.blocknews.net | 563 | TLS/SSL |
| Giganews | news.giganews.com | 563 | TLS/SSL |
| Usenet.Farm | news.usenet.farm | 563 | TLS/SSL |
The hostname is the endpoint tested, not proof of backbone identity. A provider may offer additional regional hostnames, and a hostname or server arrangement can change after the test.
Limitations and future work
What this test does not show
This test intentionally measures retention only. It does not measure:
- complete NZB success or failure;
- PAR2 repair requirements or repair success;
- download speed, latency, throttling, or connection quality as a user experiences it;
- the behavior of every newsgroup, poster, file type, or indexer;
- differences between all available regional endpoints;
- future retention after the test date;
- the legal status or policy of any particular post.
What is still missing, and what I would test next
A future edition could make the results even more useful without replacing this retention measurement:
A combined decision view. Put retention, completion, speed, price, and backbone diversity next to one another instead of trying to make one percentage answer every question.
Completion testing. Run a full download-and-repair pass on a subsample of the same NZBs to measure actual completion and PAR2 behavior instead of inferring it from segment availability.
Download experience. Measure speed, latency, throttling, and connection stability alongside availability, since retention alone does not describe a subscription.
Wider pairing analysis. This run compared providers in pairs over four broad age bands. Three-way combinations and a finer age breakdown would show how many genuinely independent sources it takes to cover a given age, and combining a joint view with completion testing would connect it to actual download success.
Conclusion
What the test found. The probability that a sampled binary segment from a given year is still available varies strongly by provider. Eweka and Newshosting maintained the highest availability across the full period this sample can measure; TweakNews and PureUsenet matched them for several thousand days and then fell off sharply; EasyUsenet and Blocknews faded earlier; and Giganews, ViperNews, Usenet.Farm and UsenetExpress all fell off a cliff around 90 days — with UsenetExpress recovering substantially at older ages and the other three only partly. Three findings carry the most weight: recent binary retention is broadly similar across providers; older material produces substantial divergence; and the divergence follows backbone and ownership groups rather than brand names.
What a subscriber should do with it. Match the provider to the age of the material you actually download. For recent posts, any of the ten works and the choice is about price, speed and resilience. For anything older, keep one long-retention account and add a second from a different owner: in this sample the second account’s value came from failing on different posts, not from matching the first one’s retention. Check the current provider map before buying, since ownership and backbones change.
What not to conclude. Segment retention is not NZB completion — a 95% availability figure here says nothing about whether a download finishes. Provider accounts are access services, not archives: material can disappear network-wide, and no second account brings it back. The exact hierarchy above is specific to this sample — roughly 12 NZBs per posting day, checked in July 2026 — and providers change storage, policy and ownership, so treat the tiers as a picture of this test, not a permanent ranking. And shared failures are evidence of overlapping archives, not proof of shared infrastructure.
Thanks
Thank you to everyone who supported this work, shared experiences, answered questions, provided test accounts, and helped make access to these providers possible. A test of this size would not have been practical without that support.